How to Read One Kart Lap in AiM Race Studio 3
Plot two laps by distance, switch on Time Compare, read speed, then RPM, then the split report. Menu names checked against AiM's RaceStudio 3 manual.

How do you read one lap in Race Studio 3?
Open the session, put two laps on the screen, plot them by distance and switch on Time Compare. Then read speed first, RPM second and the compare strip third. After that, the split report tells you which part of the lap holds the time.
That is the whole method. The rest of this page is where each of those things lives in the software, using AiM's own names, so you are not hunting through menus with a file that took you a weekend to collect.
One thing before we start. I checked every menu name and default on this page against AiM's RaceStudio 3 manual, the version they updated in October 2026. I did not click through the software for this page, and the last section lists what the manual does not say.
How do you get the session open?
If you downloaded the session from the logger with Race Studio 3, it is already in the analysis database. AiM says the download adds every session to it by default. If it did not, the setting is a checkbox called "Use RaceStudio 3 Analysis" in the Data Download Preferences panel.
Old files from a drive go in through the cogwheel at the top of the left column, with "Import Folder" or "Import File(s)".
The first page you see is the database: sessions in the middle, filters on the left, a preview on the right. Select your session and use the icon called "Open selected session(s) for analysis". The preview already shows you the laps summary, so you can see the lap times before you open anything.
What do you see when it opens?
The AiM default profile. AiM's words: a profile is made of layouts, and a layout is made of panels. The layout you want is Time-Distance. It has four panels, shown in the figure.
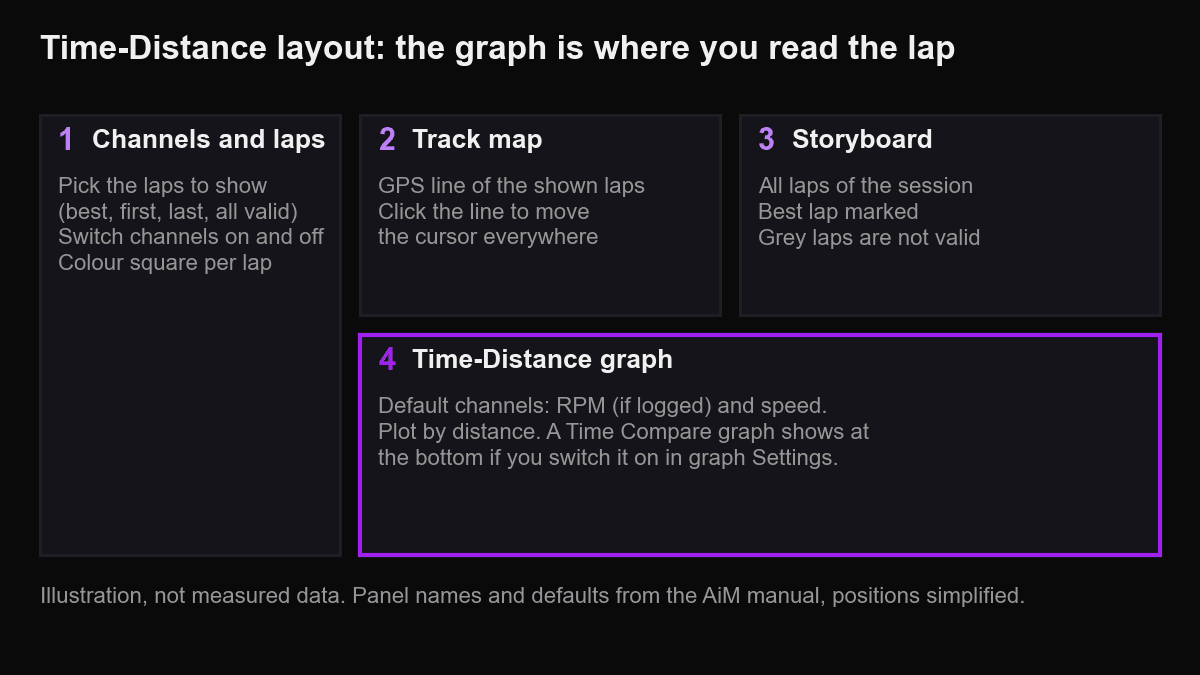
The first time it opens, the best lap is already shown and the cursor sits in the middle of the lap. In the storyboard, laps with a grey background are not counted by the best lap algorithm. Normally those are your in lap and out lap, so they are not your pace.
The cursor is shared. Click the driven line on the track map and the cursor moves in the graph too, in every layout. That is the quickest way to ask "where on the track is this bump".
Which laps should you put on the screen?
Two. One lap alone tells you very little, you need something to sit next to it.
The "Laps" button lets you show the best one, three or five laps, the first or last ones, the laps with the best segment, or all valid laps. In the laps list you can also switch single laps on and off. Shown laps apply to all layouts. Shown channels apply to the layout you are in.
If you are alone and have nobody to compare to, take your best lap and the lap where you carried the most speed through the corner you care about. That is a real comparison, and it is yours.
Should the graph be on time or distance?
Distance. The plot buttons above the graph give you run distance or time on the X axis. With time, two laps stop lining up as soon as one of them is a bit slower, so a corner is not at the same place on the screen. With distance, the corner is where the corner is.
AiM's own examples of Time Compare are all drawn with the plot base on distance. In distance plotting the splits also show on the graph, and a double click on a split zooms the graph to that split.
How do you turn on Time Compare and read it?
Right click on the graph, choose "Settings", and find the Time compare setting. It can be hidden or shown, and shown as "Differential" or as "Gap". When it is on, the Time Compare graph sits at the bottom of the graph view.
It works against one reference lap. Each open lap carries an icon for its status, and one of them marks the reference lap. The graph shows the time difference between that lap and the others you loaded. Check which lap has that icon before you read anything, because the whole strip is relative to it.
Now the reading. I do not look at the number at the end of the lap, I already have it, it is the lap time. I look for the steps. Where the line is flat, the two laps are doing the same thing. Where it climbs, the lap is losing time at that place. Each step is a corner and the size of the step is what that corner cost.
Which channel do you read first?
GPS speed. The speed trace is the lap: every dip is a corner, the bottom of the dip is your minimum speed. I look at the shape first. A V means the driver stopped the kart in the middle and picked it up from low. A U means the speed was carried. In a single speed class you want the U, because there is no gearbox to hide it.
RPM second. In the default view RPM is already there if the logger recorded it, next to speed. RPM tells you whether a speed spike is real: if the speed jumps and the RPM does not move, that is the GPS and not the kart.
And the compare strip third, because it tells you which of the dips you just saw is the expensive one. If you want more on the shapes, how to read a speed trace goes through them, and kart RPM data covers the engine side.
Where do you see which section costs the time?
In the Split Times Report layout. It divides every lap into segments and gives you the time spent in each. The manual lists the statistics you can switch on under the table:
- Average and median: the typical time of each segment across the laps you loaded.
- Best theoretical: the sum of the best segment times, even if they come from different laps.
- Best rolling: the best lap time you really made when the segments come from consecutive laps, so it is a lap you could have driven.
- Standard deviation: how constant you are in that segment. AiM says a low value means the driving follows a rule.
A table can also show every segment as the difference against the same segment of the best lap. That is the same idea as the Time Compare strip, only in numbers per segment. A big standard deviation in one segment means you do not repeat it there. That is a different problem from a segment that is slow every lap, and it gets a different fix. For the consistency side see lap consistency in karting, and for sections sector analysis.
How do you save the screen so you do not rebuild it?
Save it as a profile. AiM says a profile can be applied to any session. In the analysis window behaviour settings you choose whether the profile always saves, never saves or asks you. The space bar hides and shows panels, once you enable the checkbox "Hide/show when Space Bar gets pressed" in a panel's settings.
Build one screen with speed, RPM and Time Compare, save it, and every session opens the same way.
What did I not verify?
The manual shows the Time Compare reference lap with an icon, but the pages I read do not say how to change it, or which lap is the reference when you open a session. It also does not say whether Time Compare needs the distance plot, so I only say that its examples use distance. Check the icons on your own laps.
It also does not explain what "Differential" and "Gap" each draw, so I have not explained them. Try both on one pair of laps and see which one you can read.
What the data cannot tell you is why. The trace gives you the number and the place. The video and the driver tell you the reason, and that one belongs with what a coach looks at first in Race Studio 3.
Source: AiM RaceStudio 3 manual, chapter 4, RaceStudio 3 Analysis.