The Friction Circle (G-G Diagram) Explained for Karting
The friction circle shows whether you're using all the grip your kart has. How to read the G-G diagram, what a kart's cloud should look like, and the gaps that cost time.
Your tyres don't know whether they're braking or cornering. They only know how much total force they're being asked for.
That single fact is the friction circle, and in karting it's the most underused picture in the analysis software. Plot lateral G against longitudinal G for a whole lap and you get a cloud of dots. The shape of that cloud tells you whether you're spending all the grip you paid for.
Most drivers never open this graph. Their loss. Let me show you what they're missing.
What the diagram shows
Two axes. Left-right is lateral G, the cornering force. Up-down is longitudinal G, braking one way and acceleration the other.
Every fraction of a second of the lap becomes one dot. A full lap becomes a cloud, and the edge of that cloud is your grip limit as you actually used it. The theoretical boundary is a circle: 100% braking, or 100% cornering, or any blend that keeps the combined force inside the tyre's budget.
Force is a budget, not a buffet. Ask for full braking and full cornering at the same moment and the tyre doesn't negotiate, it just lets go. That's most spins you've ever had, described in one sentence.
Spend less than the budget in one direction and you can spend the remainder in another. That blending is the entire art of corner entry, and the diagram shows whether you're doing it or just talking about it.
Reading the friction circle in karting
A kart's cloud has its own shape, and it's worth knowing before you judge yours.
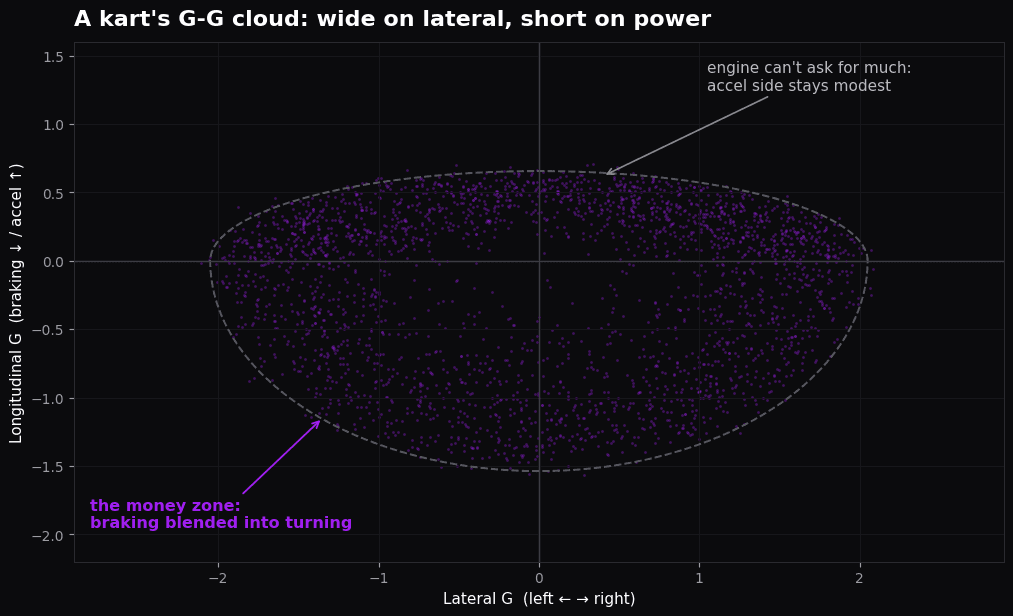
No wings, so no aero point on the braking side like you'd see on a downforce car. No suspension, so the dots respond instantly to every input. And not much engine, which makes the acceleration side short and flat. What's left is a wide, fat shape: karts live on their lateral grip. The braking side still matters enormously, because a kart sheds speed with its whole chassis, tyres scrubbing and frame flexing, and the drivers who win entries show it here.
The money zones are the upper corners of the cloud, where braking blends into cornering. That's the entry phase. Win the entries and the diagram shows it as dots crowding the boundary diagonally, brake and steering working together instead of taking turns.
The questions I ask this graph
When I compare two drivers' G data, I run the same checklist every time.
Who has the highest combined G on entry? Who turns in earlier, which you can see in where the lateral G starts building? Who pulls the most lateral G mid-corner, which tells you whose kart is rotating and gripping hardest?
And then the one that catches everyone: how does the lateral G behave on exit? If it drops suddenly, the kart has run out of traction and is sliding wide. If it stays high for too long, there's probably too much rear grip and the kart is pushing, scrubbing speed while it fights you.
Run them in order and write one sentence per corner. A verdict you didn't write down gets re-litigated at the next round. Usually in the wrong direction.
Four questions, one picture. That's a full corner diagnosis before you've opened a single speed trace, and it pairs with the valley reading in how to read a speed trace.
The gaps are the lap time
Here's the habit to build. Stop admiring the dots. Read the empty spaces.
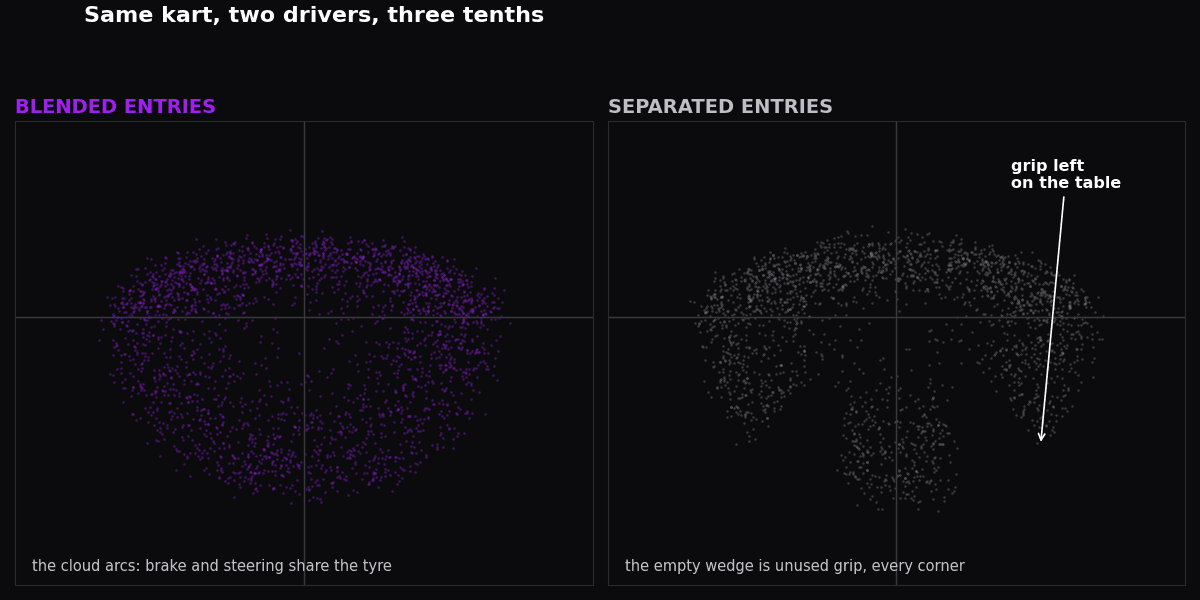
A gap between the braking zone and the cornering zone means you finish your braking, pause, and only then build steering load. The tyre sits under-used during the hand-over. The fix is trail braking, and on the diagram you'll watch the gap fill into a smooth arc as the technique arrives. The diagram doesn't soften the news the way a polite coach might. That's exactly its value.
A one-sided cloud, fatter turning left than right, is also information. Sometimes it's just the track layout. But if it survives across different circuits, something is asymmetric in the chassis, the seat, or the driver, and that's a conversation for setup before it's a driving problem.
Two drivers, one corner, in G
Here's a comparison I see constantly with juniors. Same corner, same kart model, three tenths apart, and the speed traces look frustratingly similar.
The quick driver's entry shows combined G peaking while the brake is still working. Call it 1.8G, blended. The slower driver shows 1.6G of pure braking, a beat of nothing, then 1.6G of pure cornering.
Both drivers touch similar peaks. Only one of them ever asks the tyre for two jobs at once. Watch a junior discover this and you can see the lap time arriving before the stopwatch confirms it.
On the diagram, the first cloud arcs through the corner of the graph. The second one turns like an L. The three tenths live in that little empty wedge, and which corner types punish it hardest is mapped in karting corner types.
Training your eye on it
Don't try to read the whole cloud at once. Filter the view to one corner and one lap, and watch the dots draw in sequence as you scrub the cursor; nearly every package animates this.
Then ask only the entry question. Do the braking dots hand over to the cornering dots through a curve, or through a corner? Ten corners of watching that and you'll never unsee it.
Five minutes after each session is plenty. This graph is a weekly X-ray, not a lap-by-lap obsession. Check it after test days especially. New tracks expose entry habits brutally.
Why does this graph reward karts so much? Because there's no suspension between the input and the dot. In a car, springs and dampers launder the driver's hands before the accelerometer sees them. In a kart, you are the suspension, and the diagram is a polygraph wired straight to your wrists and right foot.
And calibrate against the stopwatch every time, the discipline that runs through the whole karting telemetry guide.
Don't chase the circle for its own sake
Now the concession, because this graph has a trap in it.
Big G numbers are not the goal. A sliding kart generates impressive lateral G while going slower, because scrubbing is force without progress. A driver can fill the boundary beautifully and still be three tenths off, over-driving every entry, as I covered from the braking side in karting braking technique.
So the friction circle is a diagnostic, never a target. Use it to find where grip sits unused, then confirm against lap time and the delta. Force tells you effort. The stopwatch tells you speed. They're cousins, not twins.
I'll take the boring version of this graph with a faster lap time over the heroic version with a slower one, every single weekend, and so should you.
Where to find it, and a number to expect
Every mainstream analysis package draws this graph, usually named G-G, GG plot or combined G. The accelerometer in any modern kart data logger feeds it as standard; some software derives it from GPS instead, which works but smooths away the sharpest moments.
Mount the logger like you mean it, because every vibration you bolt into the bracket gets drawn on this graph as fake bravery, and fake bravery is the expensive kind.
What should the numbers be? From experience, not from a lab. A sprint kart on fresh rubber and a gripped-up track spends its mid-corner life around 2G of lateral, sometimes spiking past it.
A rental kart on hard tyres lives nearer 1 to 1.5G. Treat those as orientation, not targets, and compare against karts in your own class on the same day.
If you want the car-racing theory underneath, Trailbrake's G-G diagram primer is solid. VR Performance Development wrote a deeper technical explainer on why real clouds are ellipses rather than circles.
FAQ
Is the friction circle the same as the traction circle?
Yes. Friction circle, traction circle, G-G diagram and GG plot all name the same graph: lateral force against longitudinal force, with the tyre's limit as the boundary. Car people argue about which term is proper. The picture doesn't change.
Do I need a special sensor for it?
No. Practically every kart logger sold in the last decade has a built-in accelerometer, and many packages can derive the G data from GPS. Check that the logger is mounted firmly, because a vibrating unit fills the diagram with noise that looks like heroic driving.
Why does my cloud have ragged dots far outside the boundary?
Kerbs, bumps and vibration. A kart hammers its accelerometer in ways a car never does, so single wild dots mean nothing. Read the dense edge of the cloud, not the outliers, and apply your software's smoothing if the scatter hides the shape.
What does a perfect karting friction circle look like?
A wide, connected arc from the braking zone through both cornering edges, with no empty wedge between braking and turning. Not a perfect circle: the acceleration side will always be modest, because the engine can't ask the tyre for what a braking zone can.
Alessio Lorandi started karting at six and won the 2013 CIK-FIA Karting World Championship. He raced through Formula 3, GP3 and Formula 2 before founding Purpl, an AI data coach for karting drivers.