Category: Uncategorized

  • Mounting and Wiring a Kart Data Logger the Right Way

    Mounting and Wiring a Kart Data Logger the Right Way

    Bad installs don’t fail loudly. That’s the problem.

    A loose mount, a cable near the ignition lead, a sensor a few millimetres off, and the logger keeps drawing beautiful traces. They’re just fiction. Kart data logger installation is twenty minutes of care that decides whether every download afterwards tells the truth.

    Here’s the install, step by step, and the checks that catch a lying setup before it costs a weekend.

    Bench first, kart second. Lay the unit, loom and sensors out on a bench, connect everything, and power it up before any of it touches the chassis.

    You’re looking for one thing: live channels. A sensor that reads dead on the bench is a faulty part found in two minutes, not an install mystery that eats two race weekends.

    Then the kart, in order. Mount the unit, seat the sensors, route the cables loosely, and power up again before anything gets tightened or taped.

    A channel that was alive on the bench and dead on the chassis points straight at one cable run. The order sounds fussy. It saves hours.

    Kart data logger installation guide cover with purple wiring diagram on black

    The dash mount: tight beats clever

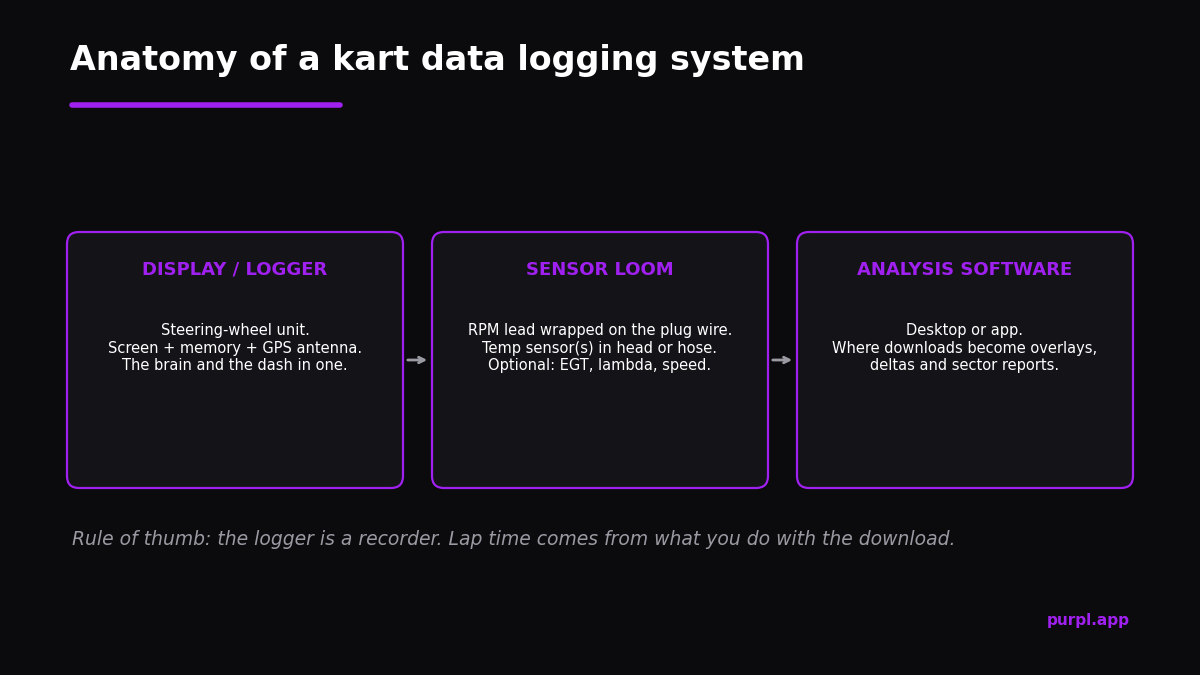
    The logger lives on the steering wheel or the dash bracket, and it lives a violent life there.

    A kart vibrates harder than almost anything else in motorsport, so the mount’s first job is to not loosen, ever. Use the bracket made for your wheel, torque it properly, and re-check it as part of the weekend routine. Because a unit working loose smears the G data, and eventually the GPS too.

    Community install guides such as GoKart36’s logger 101 repeat the same first rule: tight, then everything else.

    Angle matters for two reasons. You need the screen readable in your normal eye-line for the dash glance, and a GPS antenna inside the unit wants the flattest view of the sky the mounting allows.

    Give the GPS its sky

    If your logger has an external GPS antenna, its position is the single biggest data-quality decision in the install.

    Flat, sky-facing, and clear of your body. Not tucked under the front fairing, not shadowed by your torso at full tuck, and rigid, because an antenna that bounces smears every sample. The reasons live in GPS accuracy; the install is where you act on them.

    And keep it away from the ignition system. The lead and coil are the two great noise sources on a kart, and centimetres of distance from them buy cleaner channels than any spec upgrade.

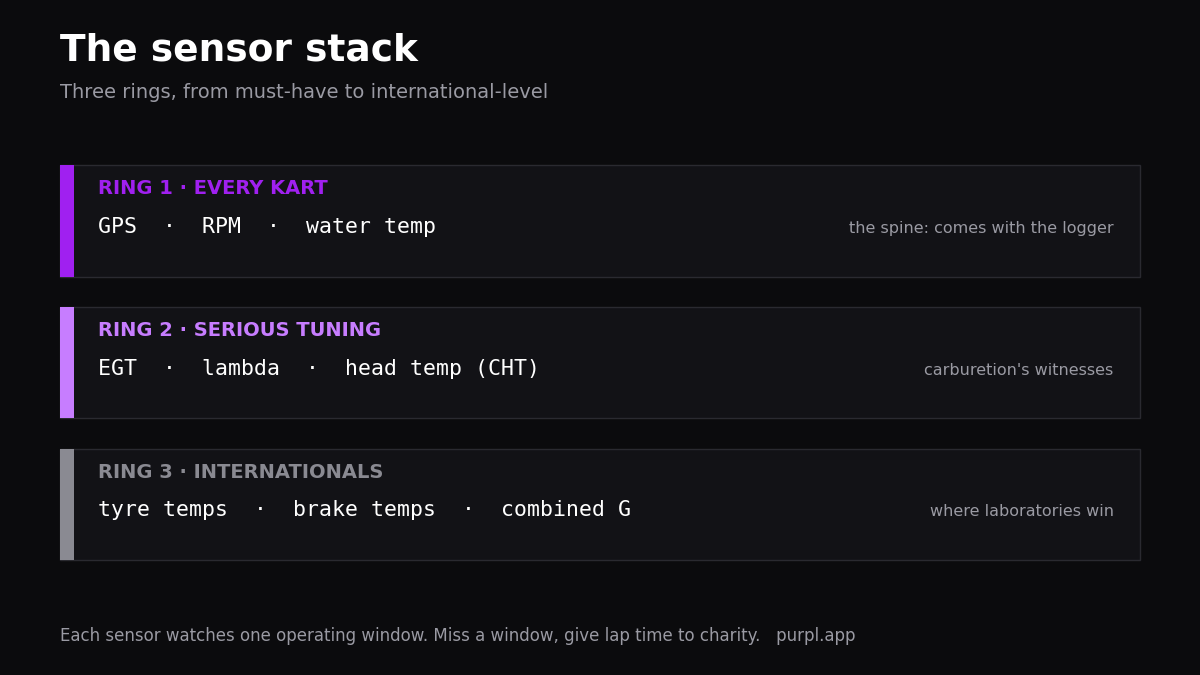
    Sensor by sensor, the placements that matter

    Mounting data logger kart placements: RPM lead, water probe, EGT distance, strip sensor height

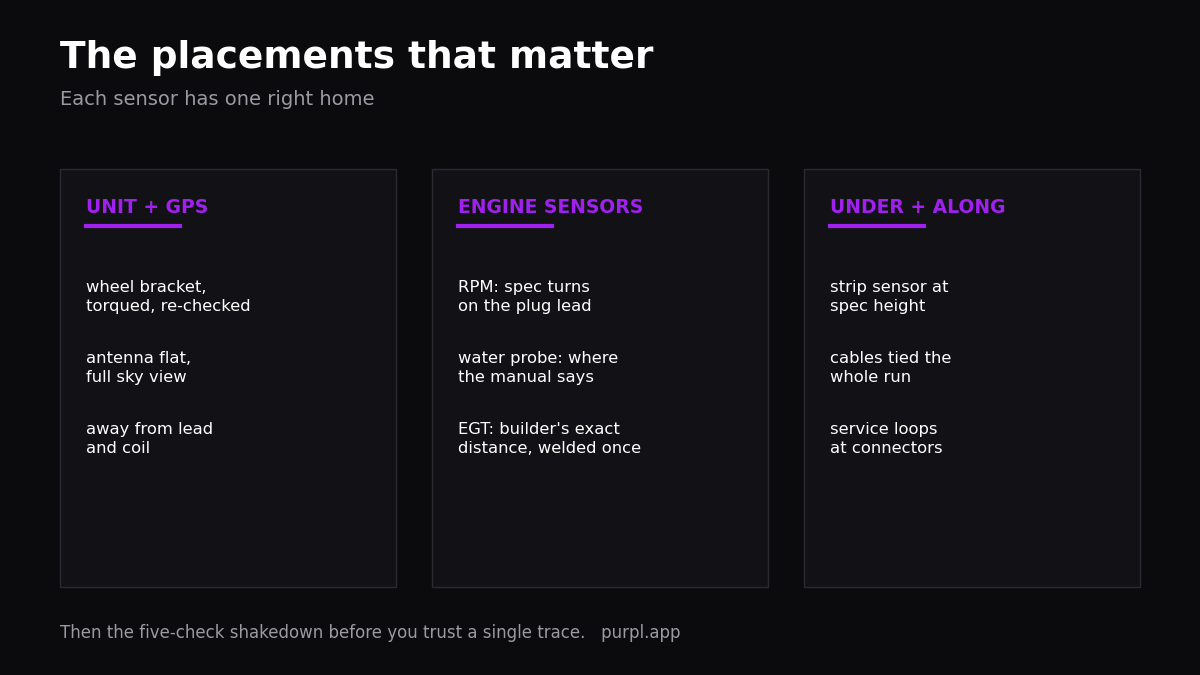
    RPM. A wire wrapped around the spark plug lead, following the unit’s specified number of turns. Too few turns reads dropouts, too many reads noise, so route it away from other cables and tape the end where vibration can’t unwind it.

    Water temperature. Seat the probe exactly where your engine manual says, and remember the location defines what your numbers mean, head exit reads hotter than radiator return. Consistency beats position, per kart water temperature.

    EGT. The probe distance from the piston is specified by your engine builder, and comparisons only work between karts probed at the same distance. Drill and weld once, properly, the rule from the EGT guide.

    Magnetic strip sensor. Hangs under the floor tray at the height the manual names. Too high and it misses the field; too low and the first kerb removes it.

    Routing and wiring: the boring half that decides everything

    Cables fail at race pace, not on the bench. Route for the worst lap, not the garage.

    Three rules cover most of it. Tie every cable down its whole run, snug enough that nothing can catch, with slack only at the steering rotation point.

    Cross other cables at right angles instead of running alongside the ignition lead. And leave service loops at connectors, because a cable with zero slack transmits every vibration straight into the pins.

    Trim every tie tail flush. A sharp tail sitting against a cable saws through insulation lap after lap, and the damage it does shows up months later as a “random” glitch.

    Connectors get dielectric grease if they’ll see rain, and a strip of tape as a backup against vibration. None of this is glamorous. All of it is why some karts’ data never glitches and some karts’ data is a weekly mystery.

    Rain changes the job. Water finds pins.

    Before a wet session, give every exposed connector a drip loop. Let the cable dip below the connector before it rises into the pins, so water runs to the low point and drips off the cable instead of tracking inside.

    Fresh grease in the connectors, tape over anything that faces the spray, and a quick wipe of the head unit’s seals before it goes back on. None of it takes ten minutes. All of it beats drying a loom with a heat gun on Sunday morning.

    The first-session shakedown

    Never trust a fresh install until it survives this five-check shakedown, run after the first session on track.

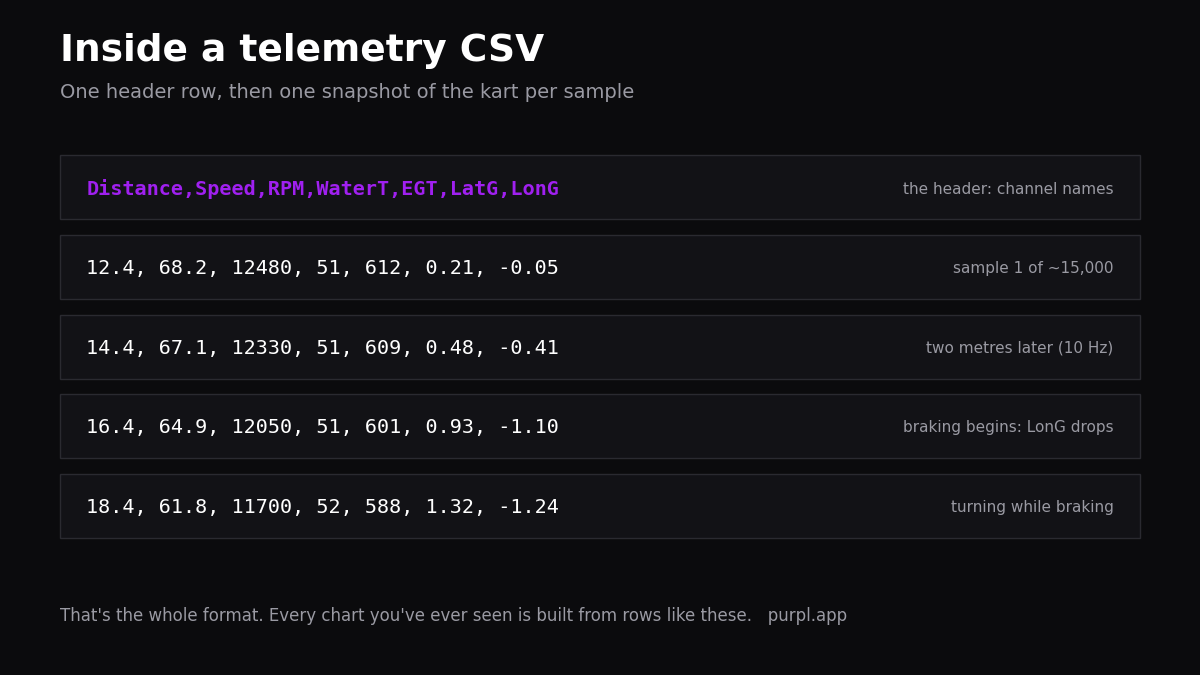
    Lap distance matches the track’s published length. Speed-to-RPM ratio holds steady on a single-gear kart. Temperatures respond to the real world, climbing on the out lap, reacting to the curtain.

    G traces show corners, not fuzz. And the lap count matches reality, no doubles, no misses.

    Any check fails, fix the install before reading anything else, because conclusions from a lying logger cost more than no conclusions at all. That’s mistake ten in data analysis mistakes, and it’s the most preventable one on the list.

    Five clean checks and the unit has earned its place. From there the work moves to reading, and the karting telemetry guide covers that whole side.

    The maintenance rhythm

    Installs age. The rhythm that keeps them honest is short and weekly.

    Every race weekend: one minute checking the mount bolts, the RPM wrap, and the visible cable runs. Every month: connectors opened, inspected, re-greased where needed, and the battery contacts checked alongside the charging habits from battery care. After any crash or kerb strike: the full shakedown again, because impacts move things that look unmoved.

    Karts shed bolts weekly. Assume the logger’s hardware is no exception, and it never gets the chance to surprise you.

    And write the logger checks into the same list as the chain and the hubs. Habits survive. Memory doesn’t.

    When to suspect the install

    A short field guide, because install faults wear data costumes.

    Speed spikes nothing else explains: antenna or mount. RPM dropouts at high revs: the plug-lead wrap.

    A temperature that ignores the curtain: probe seating or connector. Missed laps: strip sensor height or gate placement, the full tree in lap timer troubleshooting.

    Picture the classic case. A kart arrives with speed spikes on every straight, and the owner is sure the logger has died. The mount gets checked: solid.

    Then the antenna cable turns up loose at the steering column, where the loop was cut too tight and full lock has been tugging the plug for weeks. Re-route, re-tape, spikes gone. The fix cost a cable tie.

    The pattern in all four: the symptom appears in one channel while the others stay sane. Real driving events show up across channels together. Lonely glitches are wiring, and now you know where to look, with the wider context in kart data loggers explained and kart sensors explained.

    FAQ

    Where should I mount my kart data logger?

    On the steering wheel with the manufacturer’s bracket, torqued properly, screen in your natural eye-line. The wheel position survives vibration best and keeps the dash glance fast. Chassis mounts work for units without screens, with the same tight-and-rigid rules.

    If the wheel is crowded, the dash bracket on the steering support is the usual second choice. Same rules: torque it, then check it weekly.

    Why does my RPM signal drop out?

    Almost always the plug-lead wrap: wrong turn count, loosened by vibration, or routed against another cable picking up noise. Rewrap to spec, tape the end, and re-route away from the loom. If dropouts continue at specific revs only, ask your dealer about the unit’s sensitivity setting.

    And re-check the wrap after every engine change. The lead comes off whenever the engine does, and the wrap rarely goes back on exactly as it was.

    Can I install a logger without a mechanic?

    Yes, it’s hand-tools work, and the manuals are decent. Budget a quiet hour, follow the placement specs exactly rather than approximately, and run the first-session shakedown before trusting anything. The install is easy; the discipline is the product.

    The one job worth handing out is the EGT weld, because a badly placed boss is permanent. Everything else forgives a second attempt.

    Do I need to remove the logger between race days?

    Take the unit indoors if nights are wet or freezing, batteries hate both, but leave the wiring and sensors installed and undisturbed. Repeated unplugging wears connectors faster than weather does. Cover the kart, pop the head unit, done.

    In a wet paddock, point the open connector downwards and drop a dry cloth over it for the night. Cheap insurance.


    Alessio Lorandi started karting at six and won the 2013 CIK-FIA Karting World Championship. He raced through Formula 3, GP3 and Formula 2 before founding Purpl, an AI data coach for karting drivers.

  • Corner Exit Speed: Why It Matters More Than Apex Speed

    Corner Exit Speed: Why It Matters More Than Apex Speed

    Drivers brag about the wrong number. The apex speed flashes on the screen, somebody’s is 2 km/h higher, and the tent treats it like a trophy.

    Meanwhile the stopwatch only cares about a different number. Corner exit speed is the one that gets multiplied, because whatever you carry out of the corner, you keep for the entire straight that follows. An apex is a moment. An exit is an investment.

    And yet the standard advice for buying that investment is mostly wrong. We’ll get to that, because it’s the part of this article some coaches won’t like.

    Corner exit speed explainer cover with purple exit acceleration trace on black

    The compounding math

    Take a corner leading onto a 150-metre straight. Exit 1 km/h down and you don’t lose that speed once. You drag the deficit all the way to the next braking board, and the slower start also means every metre of the straight is covered at a slightly lower average.

    Corner exit speed deficit compounding down a karting straight in the speed trace

    That’s why exit mistakes read so big in the data. On the speed trace they’re a lazy slope. On the delta time channel they’re a ramp that climbs the whole straight, long after the corner is behind you.

    Exits also hide behind excuses beautifully. Early in my karting I kept blaming the kart to my mechanic, “it’s sliding on exit”, no traction, while sitting around two seconds off the pace. The kart wasn’t ruining my exits. My corners were making the kart slide.

    Apex speed enjoys no such multiplier. Carry 2 km/h extra through the apex and ruin the drive, and the trace forgets your trophy within fifty metres. The straight remembers the exit.

    Multiply that across the four biggest exits at your track and you’re looking at the gap between the second row and pole, every single weekend, from corners that felt fine.

    What corner exit speed is actually made of

    Four ingredients, all visible in data.

    Rotation finished early. The kart that reaches its minimum speed early in the corner spends the exit accelerating on an open steering wheel. The kart that’s still turning at the kerb spends it scrubbing. Where your minimum happens matters as much as how high it is.

    All of the track. Using the full exit, kerb included, makes the corner’s radius bigger exactly where the power is on. I’ve reviewed laps where the driver left five centimetres of exit kerb unused, lap after lap, for no reason beyond habit. Five centimetres sounds like nothing. The racing line says otherwise.

    The engine in its band. A perfect line with the RPM below the power band still produces a dead exit. Exits and gearing are one conversation, covered from the engine’s side in kart RPM data.

    Throttle the kart can use. Earliest pedal isn’t best pedal. What counts is where speed actually starts building, the whole subject of throttle trace analysis.

    Now the part the coaches get wrong

    Here’s the standard recipe you’ll hear at every club track: prioritise exits over entries. Brake early, get on the gas early, sacrifice the way in to win the way out.

    I think that’s nonsense. Or at least, it’s not how anyone becomes a phenomenal driver.

    And some of that advice has a motive. “Prioritise exits” is also what gets said to justify a lack of speed down the straights when nobody wants to discuss the engine.

    Braking early and throttling early is the easy thing to do. And if it’s easy, where’s the advantage? Where’s the lap time nobody else can find? Michael Schumacher’s signature, the one his engineers and rivals kept describing, was carrying the highest speed into the entry of corners. Not the middle. Not the exits. The entries.

    The misconception underneath the standard advice is that a fast entry must cost you the exit. It doesn’t have to. The goal is to make both: an entry near the limit of physics AND a strong drive out. If the exit suffers, the fix is rarely entering slower. Ninety percent of the time the real problem is deceleration efficiency, how well you slow the kart once you’ve committed. That’s a braking skill, built in karting braking technique and refined through trail braking.

    So yes, exit speed beats apex speed. But you buy it with technique, not with surrender.

    What teaming with Leclerc taught me about exits

    In 2015 I was Charles Leclerc’s teammate in FIA Formula 3 at Van Amersfoort Racing, fresh out of karting. That season was a reality check.

    That season even made me question my own driving. When we compared data, Charles wasn’t beating me on the exits the way the club-track recipe would predict. He was carrying entry and mid-corner speed without losing time on the exit, V-ing the slow corners harder than me. He drove the entry on the very limit while still getting the drive. The exits looked after themselves because everything before them was right.

    By Macau at the end of the year I’d closed most of the gap. He finished second, I finished seventh. And I carried the lesson into every kart I’ve coached since: a great exit is the result of a great corner, not a substitute for one.

    When exits really do come first

    Concession time, because the standard advice contains a real grain of truth.

    The corner feeding the longest straight is the one place where trading entry for exit usually pays. More straight means more metres multiplying your exit speed, so the compromise maths shifts. Even there, the trade should be deliberate and measured, not a habit applied to all ten corners. Ross Bentley’s Speed Secrets answers the “does slow-in fast-out always work?” question with the same nuance, and Driver61’s guide to corner types maps which corners deserve which priority.

    Karting adds one twist of its own. With no gearbox in most classes, a bogged engine punishes a stopped corner harder than any car. That’s why low-powered karts bias toward rolling speed everywhere except that one cash-out corner. The full corner taxonomy is in karting corner types.

    Reading exits in your data

    Three checks after every session, ten minutes total.

    First, exit slope: pick your three corners onto the longest straights and compare the climb out of each against your best lap or a teammate’s. Second, speed at a fixed point 100 metres after each of those corners; that single number is your exit grade, compounding included. Third, where the slope breaks: a step means wheelspin or a pinched line, a late start means the corner was over-slowed.

    The fixed-point speed check is the one I’d keep if you keep only one, because it converts a feeling argument into a number argument in ten seconds flat.

    With a reference lap, the questions get sharper: who gets the better exit, and why? That’s one of the core questions in the overlay method, and the answer is usually visible in one evening.

    The could-have audit

    Here’s an exercise from my own debrief routine. After a session, pick your three most important exits and ask two questions of each.

    Could I have picked up the gas half a metre earlier, even if it felt like the limit of push understeer? Could I have used a touch more track on exit, even feeling I was at the edge of dropping a wheel?

    The answer is almost always yes to one of them. Half a metre. Every exit. Every session. Feelings run conservative. The audit converts felt limits into tested limits, half a metre at a time, and the data grades every test the same evening.

    FAQ

    Is exit speed or entry speed more important in karting?

    Wrong question, honestly. Exit speed determines your straight; entry skill determines how much exit you can have without giving the corner away. Prioritise the exit’s result, build it with entry technique, and reserve the deliberate entry-for-exit trade for the corner onto the longest straight.

    How do I measure my corner exit speed?

    Pick a fixed distance marker after the corner, 50 or 100 metres, and read GPS speed there on every lap. Tracking that one number across sessions beats staring at the whole trace, and any logger from the data logger guide provides it.

    Why is my exit speed low even when I’m on the throttle early?

    Because the pedal isn’t the drive. If the kart is still rotating, sliding, or below its power band, early throttle produces noise instead of acceleration. Check where speed actually starts climbing, and check your minimum-speed position: a late minimum poisons every exit that follows it.

    Does a higher apex speed ever matter?

    Yes, in fast corners that flow into other corners, where carried speed is the whole game. The apex-versus-exit trade is corner-specific. What never matters is apex speed as a bragging number divorced from what it did to the lap.


    Alessio Lorandi started karting at six and won the 2013 CIK-FIA Karting World Championship. He raced through Formula 3, GP3 and Formula 2 before founding Purpl, an AI data coach for karting drivers.

  • Exporting Telemetry to CSV: Analyze Your Kart Data Anywhere

    Exporting Telemetry to CSV: Analyze Your Kart Data Anywhere

    Your data shouldn’t be a prisoner of one program. Every analysis package can set it free, and almost nobody uses the door.

    Export telemetry CSV files and the laps you drove become plain numbers in a plain text file. Numbers a spreadsheet can chew on, a season can accumulate, and no software licence can hold hostage. Some of my most useful karting analysis ever happened in a humble Google Sheet, not in any racing program.

    Here’s how the export works, what’s inside the file, and a ready-made spreadsheet to paste into.

    Export telemetry CSV guide cover with purple spreadsheet grid on black

    Why bother, when the software has charts

    Three reasons, in rising order of importance.

    Custom questions. Analysis packages answer their own menu; a spreadsheet answers yours. Consistency spreads, fixed-point exit speeds, season trends, none of which come standard. Sharing. A CSV opens for your tuner, your coach and your dad without anyone installing anything. And ownership. Software comes and goes, file formats get retired, but a folder of CSVs is yours forever.

    I’ve changed logger brands more than once across my career, and the only data that made every move with me was the boring text files nobody can discontinue.

    The deeper analysis still happens in the proper tools, the routine from how to analyze kart racing data. The spreadsheet is for the questions those tools don’t ask.

    How to export telemetry CSV from kart software

    Every mainstream package does this, whether it’s Race Studio, Alfano’s software or Unipro’s, and the recipe barely changes.

    Open the session, pick the laps worth keeping, find Export or Save As in the file menu, and choose CSV. You’ll usually get asked two things: which channels to include, and whether samples should be spaced by time or by distance. Take distance if the option exists, because distance-based rows line up between laps, which is what makes comparisons possible later.

    One habit while you’re there: export the whole session, not just the glory lap. The slow laps carry the consistency story, and the out lap occasionally explains the whole afternoon.

    Keep the channel list short on purpose. Speed, RPM, water temp, EGT and the G channels cover nearly every spreadsheet question, and a lean file opens fast a season from now.

    What’s actually inside the file

    Racing data csv export anatomy: header row, one sample per row, channel columns

    Don’t be scared of the word “file format” here. CSV stands for comma-separated values, and it means exactly that: numbers with commas between them, the least mysterious format computing ever produced. That’s it. That’s the whole trick.

    Open one in a text editor once, just to demystify it. A header row naming the channels. Then one row per sample, ten or twenty-five per second depending on your logger, each row a snapshot: distance, speed, RPM, temperatures, G.

    That’s the entire format. A 12-minute session is maybe fifteen thousand rows, which sounds like a lot and is nothing to a spreadsheet. Every chart your analysis software draws is built from exactly this table, and now you can build your own.

    The session sheet: my favourite spreadsheet trick

    The most valuable spreadsheet in karting doesn’t hold samples at all. It holds one row per session, and I learned it tracking parameters the long way.

    Average tyre temps, average hot pressures, average water temperature across the fastest lap. EGT minimum and maximum logged separately, because they describe the bottom and top of the carburetion independently. RPM minimum and maximum, plus metres spent on the limiter. Then colour-code each cell against its operating window: green inside, red running hot, blue running cold.

    One glance at the colours tells you which parameter left its window before the tent starts arguing. Numbers have got no emotions, and a colour-coded row of them is the calmest debrief tool I know.

    Start the sheet even if you only log three columns today. Date, best lap, spread. The other columns fill themselves in as sensors arrive, and the early rows become the baseline your future upgrades get judged against.

    The starter spreadsheet

    I’ve built that sheet for you, plus the lap-time math from this blog’s analysis articles.

    Download the free starter spreadsheet (Excel format). Three tabs. A session log with the parameter columns and colour scales pre-built. A lap-times tab: paste a column of laps and it computes your best, average, spread and the within-a-tenth window count automatically, the numbers from lap consistency. And a read-me explaining each formula, so the sheet teaches instead of just calculating.

    It opens in Excel, Google Sheets and LibreOffice. No email wall, same as the debrief template. Take it, change it, make it yours, because the sheet that survives a season is always the one you rebuilt in your own image.

    What a season of rows can tell you

    The sample-level file answers lap questions. The session sheet answers career questions, and those are the fun ones.

    Does your spread shrink month by month? Which tracks rate you and which flatter you? Does your pace drop after lunch, every time, the way mine warned me to change what I ate? One row per session, forty rows a season, and the answers just sit there in a chart.

    I did a crude version of this as a kid with rental-kart timesheets. I’d paste the lap times into a sheet, compute my average and my variance, and chase one goal: a lower number next visit. Same idea, better tools now. The kid with the printed timesheet and the team with the engineering suite are doing the same homework, and the homework is what counts.

    No racing software will ever draw you that chart, because no racing software knows your whole season. Your spreadsheet does.

    Three traps in the export

    CSV is simple, but three details bite people every season.

    Decimal commas. European software sometimes writes 52,18 where a spreadsheet expects 52.18, and every formula quietly breaks. If your numbers import as text, fix the locale or use the import wizard. Units. Check whether speed came out in km/h, and whether temperatures are what you think; a header row read once saves an evening of confusion.

    And derived noise. If you compute acceleration or anything else from sample-level data, smooth it first, the warning from math channels. Raw differentiated GPS looks like a lie detector having a bad day. Smooth first. Conclude second.

    A five-minute recipe to start tonight

    Don’t build a system. Steal this one.

    Export your last session with speed, RPM and water temp. Open the starter sheet, paste your lap times into the lap tab, and read your spread and window count. Then add one session row with the numbers you have, even if half the columns stay blank. Half-filled sheets still beat full memories, and they beat them by more every month.

    That’s it. The sheet grows a row per session from here, and the blank columns quietly tell you which sensor to think about next, the shopping logic from kart sensors explained.

    Where this fits in the bigger picture

    The CSV habit is the bridge between owning data and owning your development.

    Session files feed the analysis software for the corner-by-corner work. The exports feed the spreadsheet for the season-level work: trends, windows, consistency curves. Both habits compound, and both survive any change of logger brand, which matters more than people think over a karting career. If you want a structured path through the wider skill set, Samir Abid’s data analysis learning guide is a solid vendor-neutral map. And overlay tools like RaceRender happily eat the same CSVs for video work.

    Your numbers, your files, your questions. That’s the whole pitch, and the full channel-reading method stays in the karting telemetry guide.

    FAQ

    Which channels should I include in a telemetry CSV export?

    Speed, distance, RPM, water temperature, EGT if you log it, and lateral plus longitudinal G. That set answers the spreadsheet questions worth asking while keeping files small. You can always re-export with more channels for a special investigation.

    Can Google Sheets handle a full session export?

    Comfortably. A session at 10 Hz is in the low tens of thousands of rows, well within range. If things get sluggish, export fewer laps or fewer channels; for lap-level work like the session sheet, you barely need a hundred rows a weekend.

    Is CSV export the same as backing up my data?

    No, keep both. The CSV carries the numbers but loses the software’s session structure, beacons and settings. Back up the native files for re-analysis, and export CSVs for the spreadsheet layer. Disk space is the cheapest thing in karting.

    My exported numbers look wrong. What first?

    The header row and the locale, in that order. Wrong units explain impossible speeds; decimal commas explain numbers-as-text. If both check out and values are still nonsense, verify the export’s channel mapping against the garbage-data checks.


    Alessio Lorandi started karting at six and won the 2013 CIK-FIA Karting World Championship. He raced through Formula 3, GP3 and Formula 2 before founding Purpl, an AI data coach for karting drivers.

  • How to Run a Post-Session Debrief (Template Included)

    How to Run a Post-Session Debrief (Template Included)

    Between sessions you have maybe twenty minutes. A loud tent, a mechanic asking about pressures, and a brain that’s already rewriting what happened out there.

    That last part is the problem the karting debrief exists to solve. Memory is a terrible engineer, and it gets worse by the minute. The session you remember at dinner is a story. The session you write down within ten minutes is data. Ten minutes is the whole price.

    Here’s the routine I use and teach, plus a printable template so you can run it at the track today.

    Karting debrief routine cover with purple checklist graphic on black

    Feelings first, laptop second

    The order matters more than any single step. Before you open the data, write what you felt.

    Which corners felt strong, where the kart fought you, what you’d change blind. Two minutes, bullet points, no full sentences needed. Ross Bentley’s Speed Secrets has a good piece on remembering what you felt on track, and the core trick is the same: capture the feel before anything overwrites it.

    Coaches see it constantly. The driver swears the kart understeered all session, then the data shows the fronts barely loaded. Neither witness is lying, which is exactly why both get written down.

    Why before the laptop? Because the moment you see the traces, the data rewrites your memory, and you lose the one thing only you can log. The gap between what you felt and what the data says is the most instructive number of the day. You can only measure it if you wrote the feeling down first.

    The karting debrief, step by step

    Fifteen minutes, same order every time. Routine is the entire trick, because a debrief that changes shape every session stops happening by round three.

    1. Feel notes. Two minutes, before anything else, as above.

    2. The lap table. Best lap, theoretical best, and how many laps landed within a tenth of your best. Three numbers, straight off the software, the method from lap time analysis and lap consistency.

    3. One worst corner. Delta against your reference, find the biggest climb, open the speed trace there. The overlay method, compressed to five minutes.

    4. One verdict, one sentence. “Braking three metres early into T4 and coasting.” Written down, no hedging. If you can’t write the sentence, you haven’t finished looking.

    5. One change for next session. Exactly one. The discipline that runs through everything I write, because two changes produce zero conclusions.

    6. Close last session’s loop. Did the previous change work? Data answer, not a feeling answer. This single step is what turns isolated sessions into a season of compounding progress, and it’s the step every paddock debrief skips.

    7. Setup line. Sprocket, pressures, axle, conditions, one row on the sheet. My old mechanic kept every adjustment in his papers, and when we struggled for pace he knew exactly where to look for inspiration. Be your own version of that, with the setup notebook habit.

    The template

    All seven steps fit on one page, and the page is the product. Print a stack, clip them to a board, one sheet per session.

    Race debrief template preview for karting with session info, verdict and one-change sections

    Download the printable debrief template (PDF). It’s free, no email wall, A4, deliberately boring. The session that fills it in is the interesting part.

    If you’d rather rebuild it in your own app or spreadsheet, copy the seven boxes and keep the order. The order is the method.

    One design choice worth explaining: the “last change result” box sits at the top, not the bottom. You close the previous loop before you open a new one. That ordering is the difference between testing and wandering.

    A real sheet, filled in

    Here’s what fifteen honest minutes produce, from a hypothetical but typical club Saturday.

    Feel notes: kart loose on entry T3, strong out of the hairpin, brain checked out last four laps. Lap table: best 52.41, theoretical 52.18, four of twelve laps within a tenth. Worst corner by delta: T3, losing 0.15.

    Verdict: braking too late into T3 and arriving crossed-up, entry slide costing the whole middle phase. Change: brake two metres earlier at T3 and trail in, nothing else touched. Last session’s change: wider line in T7, confirmed by data, kept.

    One line learned: “When entry is calm, the hairpin exit fixes itself.” That sheet took less time than the espresso queue, and next session has a job.

    Why most debriefs die by round three

    Three killers, all avoidable.

    The sheet was too long, so it became homework instead of habit; one page is the ceiling. The verdicts were vague, “find more pace in sector two” is a wish, not a verdict. And nobody closed loops, so the sheets never proved their value, which is why the last-change box sits at the top of mine.

    Keep it short, keep it specific, close the loop. The routine that survives is the one that fits in the gap between sessions, with a data method behind it.

    The race-day variant

    Race days compress everything, so the sheet flexes.

    After heats, skip the lap table and go straight to verdicts. One sentence on the start, one on the best overtaking corner, one on whoever fought you hardest. Race pace outranks best laps on Sundays, the argument from delta time.

    Then the final gets the full fifteen minutes at day’s end, even exhausted, even packed up. The hardest debrief of the season is the one after a bad final. It’s also worth double.

    Make it survive the season

    A debrief sheet is worth little. Forty of them are a coaching library.

    Keep them in one folder, and read the stack back every month or so. Patterns appear that no single session shows. The same corner type costing time at three different tracks, pressures drifting the same direction every hot weekend, the one change that never sticks. Winding Road’s Speed Secrets piece on the handling debrief process pushes the same discipline from the car side: written answers, same questions, every time.

    The month-end read costs twenty minutes. It’s the cheapest coaching session you’ll ever book, and after a season it tells you exactly what the off-season homework should be.

    Debriefing with a team, a parent, or a kid

    Add people and the structure matters even more, because debriefs drift into blame without it.

    Same sheet, same order, every session, whoever is in the tent. The data plays referee: when the conversation reaches step three, the worst corner is whatever the delta says it is, not whatever annoyed the loudest person. Wearing the detective hat instead of the excuses hat changes the whole tone, the distinction I drew in data analysis mistakes.

    For young drivers, one extra rule. The kid speaks first, before parent, mechanic or coach, and the kid owns step five. A driver who chooses the change drives the change. A driver handed the change drives a favour, and favours don’t stick.

    What this looks like after a year

    Run this routine for a season and three things happen, in my experience coaching drivers who actually did it.

    The debrief gets faster, settling near ten minutes, because the questions are pre-decided. The one-change discipline starts working mid-session too: drivers begin noticing the project corner while driving it, the mental sticky-note habit from sector thinking. And the season stops feeling like twenty separate weekends. It becomes one continuous experiment with twenty data points.

    That’s what the sheet is actually for. Not paperwork. Compounding. And compounding is the only force in karting that’s free, which is a strange thing for a sport this expensive to leave lying on the table. Print the sheet. Drive. Fill it in. Repeat.

    FAQ

    How long should a karting debrief take?

    Ten to twenty minutes between sessions, and the short version beats the skipped version every time. If time is brutal, do steps one, four and five only: feel notes, one verdict, one change. That’s still a debrief. Scrolling laps in silence isn’t.

    Paper template or an app?

    Whichever you’ll still be using in August. Paper survives gloves, sun glare and dead batteries, and the physical stack invites the month-end read-back. Apps search better. I push paper at the track and photos of the sheets into a folder afterwards, the lazy version of both.

    Is a race debrief different from a practice debrief?

    Same sheet plus one section: racecraft. Where you attacked, where you got attacked, which rivals were strong in which corners, the scouting habit from sector analysis. Race pace numbers also outrank best-lap numbers on Sunday sheets.

    What if I don’t have a data logger yet?

    The routine survives without one. Timesheet for the lap table, your own references for the worst corner, the one-change rule unchanged. The template has nothing on it that requires telemetry, though the verdicts get sharper the day you add a logger.


    Alessio Lorandi started karting at six and won the 2013 CIK-FIA Karting World Championship. He raced through Formula 3, GP3 and Formula 2 before founding Purpl, an AI data coach for karting drivers.

  • Braking Technique in Karting: A Data-Driven Guide

    Braking Technique in Karting: A Data-Driven Guide

    The trait Michael Schumacher’s engineers and rivals kept describing was simple: more speed than anyone into the entry of corners.

    Not the middle. Not the exits. The entries.

    Meanwhile, at every club track in the world, coaches and parents are telling kids the opposite: brake early, get it slowed down, prioritise the exit. I think that’s nonsense.

    Or at least, it’s not how you become a genuinely fast driver. And in this article I’ll explain why. I’ll show you what “deceleration efficiency” means, and how your data shows whether you’re actually braking well or just braking safely.

    Karting braking technique data-driven guide cover graphic

    Why entries win races

    Braking early and throttling early is the easy thing to do. And if it’s easy, where exactly is your advantage supposed to come from? Everyone in the field can do easy.

    The lap time that separates phenomenal drivers from good ones lives in the hard thing. Arriving at the corner closer to the physical limit than anyone else, still making the apex, still getting the exit.

    In my best karting years I built my speed on exactly this. There was a fast corner at Lonato, the old “Chiocciola” turn two. I would take it with no brakes at all in KF3 and KF2 while others were braking for it.

    And at times drivers went off the track just trying to stay with me.

    I’m not telling you this to brag; I’m telling you because nobody taught me that corner with a rule about braking early.

    It came from years of creeping the entry limit forward. Metre by metre. And checking the result.

    To be precise about what I’m preaching: win the entry. But the deal has three parts.

    Maximum entry speed. Still stopping the kart by the apex. Still keeping a workable exit.

    Entry speed that destroys your exit speed isn’t bravery, it’s a donation to the drivers behind you.

    Deceleration efficiency: the cyclist test

    Here’s how I explain the core skill to young drivers. You’re driving your road car at 50 km/h, relaxed, braking gently and early for roundabouts like a good citizen.

    Then a cyclist falls thirty metres in front of you. Oncoming lane full. No escape to the side.

    Do you brake like you did for the roundabout?

    You slam everything the car has, as hard and late as the physics allow, because now braking distance actually matters.

    That emergency stop is closer to correct racing braking than the polite roundabout squeeze most drivers do on track.

    Deceleration efficiency means shedding the speed you need to shed in the shortest possible distance.

    Brake later. Brake harder at the start. Release progressively as grip demand shifts from slowing to turning.

    The kart spends fewer metres slow. The lap time follows.

    Speed traces comparing efficient late hard braking with lazy early braking into the same kart corner

    On the speed trace the two styles are unmistakable. Efficient braking is a steep cliff: late tip-over, hard initial drop, clean arc to the minimum. Lazy braking is a long ramp that starts early and bleeds speed gently.

    Both reach the same apex speed. One of them spent twelve extra metres getting there, and that wedge between the two lines is where the time went. Reading these shapes is a core skill from the speed trace guide.

    What braking errors cost, by the numbers

    Comparison card showing a 7 metre braking error costs up to 2 tenths in a 60 Mini kart versus half a tenth in Formula 2

    This comparison changed how some of my drivers think about braking.

    Be seven metres early into a hairpin you approach at 97 km/h in a 60 Mini, like the mechanics’ hairpin at Lonato. And you give away up to two tenths.

    Make the same seven-metre error at 300 km/h into the first chicane at Monza in a Formula 2 car and it costs about half a tenth. Same metres, four times the price in the kart, because at low speed you cross those metres so slowly.

    Karting is the discipline where braking precision is worth the most. The kids who tell me “it’s only a couple of metres” have it exactly backwards.

    The technique itself

    Karts brake with the rear axle only, no front brakes in direct-drive and most junior classes, which makes the skill unique.

    The pedal stroke: a firm, fast initial application just below locking, then a progressive release as you approach the turn-in point and start asking the tyres for cornering grip instead.

    The release is the talent. Anyone can stamp. Modulating out of the stop while the kart is still straight enough, that’s the part that takes years.

    Locking the rear briefly isn’t a catastrophe, you’ll hear and feel the skip, but a long lock flat-spots tyres and kills your entry stability.

    If you’re consistently locking, you’re stamping too hard for the grip available, braking too late for your current release skill, or carrying a chassis setup issue into the corner. That’s the kind of diagnosis covered in understeer or oversteer.

    As you advance, braking stops being a straight-line event. Carrying brake pressure past turn-in, trail braking, rotates the kart into the corner and is the natural next chapter: trail braking in karting covers it with the data evidence.

    Reading your braking in the data

    Without a brake pressure sensor, the speed trace is your braking sensor, and it tells you everything in three numbers per corner.

    Where the trace tips over: your braking point, compare it lap to lap to see if you actually do what you think you do. How steep the first third of the drop is: your initial application courage. Where the minimum sits and how long it lasts: a long flat valley floor means you over-slowed and parked mid-corner.

    Run the overlay against a quicker reference and check one corner at a time, the method from the data analysis guide. And a warning from coaching experience.

    When the data shows you braking earlier than your reference, move your point in small steps. A metre or two per session. Not all seven at once.

    The limit you can repeat is the only limit that counts, which is the entire argument of lap time analysis.

    Three drills that build it

    Deceleration efficiency isn’t installed by reading about it. So here’s the progression I use with drivers, one drill per test day.

    Drill one, the reference creep. Pick one slow corner.

    Choose a physical braking marker. A kerb joint, a crack, a paint edge. Never “about there”.

    Each run, move the marker one metre later, no more, until you can’t make the apex cleanly twice in a row. Back up one metre.

    That’s your current limit. And you found it in single steps you can repeat, instead of one heroic lunge you can’t.

    Drill two, the pressure split. Same corner, hold the braking point fixed.

    Now work only on the shape: first half of the braking distance at maximum pressure, second half tapering. Most drivers discover their “maximum” has another twenty percent in it. And the trace shows the cliff getting steeper run by run even with the point unchanged.

    Drill three, the no-brake corner. Find the fastest corner you currently brake for. And work on entering with a lift only.

    This one rebuilds your speed tolerance, the skill that made the Chiocciola story possible. And it teaches the difference between corners that need braking and corners where braking is just a habit of comfort.

    Run each drill with the data open between sessions, checking the tip-over point and the steepness. Then verify the minimum speed didn’t collapse, the full reading routine from the analysis method.

    Wet braking, briefly

    Everything above survives the rain with two amendments: the limits move massively earlier and softer, and they move lap by lap as the track changes. Initial application becomes gentler, because the rear locks instantly on a wet surface, and the release becomes even more of the skill.

    The drivers who win wet races are almost never the bravest. They’re the ones who recalibrate fastest. And the data work for that, comparing your braking shapes across a drying session, is covered in analyzing wet session data.

    Which mistake to prefer

    You will make braking mistakes. The question is which kind.

    Underpushing, braking too early and safe, feels tidy and costs you silently. Every lap. Forever.

    Overpushing, occasionally arriving too hot and running wide, costs you loudly and occasionally.

    Drivers and parents treat the loud mistake as the bad one. I’d rather see a young driver overpush: it means they’re searching for the limit from the right side. And the limit is the only teacher that never lies.

    Style yourself on the drivers whose rare mistakes are too much speed, not the ones who never make a visible mistake and never set a fastest lap either.

    One practical note before the class differences: braking skill has an ergonomic floor.

    If you sit too far from the pedals you brake with your toes and lose modulation; too close and your leg can’t deliver a fast, hard initial hit. Check that your heel stays planted while the ball of your foot covers the pedal, and that full pressure is reachable with a slightly bent leg.

    I’ve watched drivers gain a metre of braking confidence from a seat spacer, which is the cheapest braking upgrade in the sport. And the wider ergonomics topic is covered in seat position and weight distribution.

    Braking across the classes

    One technique article has to serve drivers in very different machinery, so here’s how the fundamentals translate.

    Cadet and Mini karts have modest power and grip, which makes them the perfect braking school.

    Errors are cheap. And the rear-only brake teaches weight management honestly. And a kid who masters deceleration efficiency at 95 km/h inherits it for life.

    Junior and Senior direct-drive classes raise corner speeds until braking zones compress. The technique stays identical while the margins shrink.

    Which is why the drill progression above stays in metres. Not feelings.

    Shifter karts, KZ, change the deal twice: front brakes arrive, and so does engine braking through the gearbox. Front brakes reward a later, harder initial hit because the kart stays straighter under load, and downshifts become part of the deceleration plan. If you graduate to KZ, expect your braking points to move later and your release skill to matter even more, not less.

    And rental karts, where many readers live: heavy chassis, weak brakes, often cold tyres, meaning everything happens earlier and softer. But the shape of good braking, hard early, progressive release, is exactly the same. And indoor rental tracks punish lazy shapes brutally.

    For the broader fundamentals around this, braking is one piece of the corner puzzle alongside line and steering. Start with the racing line explained with telemetry.

    For the physiology of braking markers and reference points, the technique articles at Driver61 are solid for car racing and translate well. And the karting-specific community wisdom on KartPulse is worth your evenings.


    Alessio Lorandi started karting at six and won the 2013 CIK-FIA Karting World Championship. He raced through Formula 3, GP3 and Formula 2 before founding Purpl, an AI data coach for karting drivers.

  • Sector and Split Analysis: Breaking the Lap Into Pieces

    Sector and Split Analysis: Breaking the Lap Into Pieces

    A lap time is a verdict on sixty things at once. That’s exactly why it teaches you almost nothing.

    Sector analysis in karting is the fix. Cut the lap into pieces, time each piece, and suddenly the question stops being “was that lap good?” and becomes “which third of it was good?”. Smaller questions get answered. Big ones get argued about in the tent.

    This is the method I use, from three-sector splits down to single corners.

    Sector analysis karting guide cover with purple split-time graphic on black

    What counts as a sector

    Official timing gives you three sectors, set by wherever the series planted its loops. Useful, but arbitrary. Your data logger doesn’t care about loops.

    With GPS you can define your own splits anywhere, and you should. The splits worth having follow the track’s logic: one per corner complex, with the straights attached to the corner that launches them. A straight’s time belongs to its exit. Time it that way and the data starts pointing at causes instead of symptoms.

    Most analysis packages let you save these custom sectors per track. Build them once, reuse them every visit.

    A note on words, since timing screens mix them freely. A split is the timing line itself, and a sector is the piece of track between two splits. Split times in karting usually means the cumulative time at each line. Same data, three vocabularies.

    The theoretical best: your fastest lie

    Stitch your best sector times together and you get the theoretical best lap. Every software computes it, and the maths is described well in Race Technology’s technical note. The gap between it and your actual best lap is the most motivating number in karting.

    Theoretical best lap versus actual best lap gap in karting sector analysis

    It’s also slightly dishonest. Be aware of how.

    Some sector combinations can’t coexist on one lap. The line that wins sector two can compromise the entry to sector three, so a theoretical best built from coarse sectors flatters you a little. Occam’s Racer wrote a good piece on what theoretical bests can and can’t tell you, and the finer your sectors, the smaller the lie gets.

    My rule of thumb from years of doing this: treat the theoretical best as a direction, not a target. If the gap is over three tenths at club level, you have a consistency project before you have a speed project, and that project lives in lap time analysis.

    How I run sector analysis on a karting weekend

    After each session, one table. Rows are laps, columns are my sectors, and the software highlights each column’s best in green.

    Split times karting table showing laps against sectors with best pieces highlighted

    Three reads, in order. Which sector has the biggest gap between its best and its average? That’s the inconsistent one, and it’s the priority. Which sector’s best came on a different lap than my best lap? That’s hidden pace, already proven, waiting to be assembled. And which sector never varies at all? Leave it alone, it’s done.

    Then I go one level down. Take the worst sector and open the speed trace for just that piece, the reading method from how to read a speed trace. With a reference lap alongside, the delta time channel does the pointing for you.

    Ten minutes, every session. The table tells you where, the traces tell you why.

    Then write the worst sector’s name somewhere you’ll see it at the grid. A project you can see is a project that gets driven. Two sectors of homework per weekend is plenty.

    There’s no such thing as “doing it the same”

    One belief ruins more sector work than any software limitation. The belief that a sector you nailed once is banked.

    I learned this in a qualifying I still think about. My sector three on lap two, driven on tyres that weren’t even at temperature yet, was good enough for the front row if I simply repeated it on lap three. I didn’t repeat it. And here’s the uncomfortable truth I took from that day: there isn’t such a thing as doing a sector the same as before. You either do it faster or slower.

    So a sector PB is not a possession, it’s a data point. The job is making your average sector converge toward your best sector, which is the entire subject of lap consistency.

    Rolling best: the honest version

    Fixed sectors have a blind spot: they judge the lap at the boundaries someone chose. The rolling-best method removes the boundaries.

    Take any distance window, say 200 metres, and slide it around the lap, asking at every position: what’s my best time through this window across all laps? Plot that against my current lap and the weak spots appear wherever they actually live, even straddling a sector line.

    A concrete version. Say your best lap is a 52.1. If your best time through the final 200 metres happened on a 52.6 lap, you’ve already proven a faster finish exists. Assemble it, don’t invent it.

    Not every karting package offers it under that name. You can approximate it with many small sectors, eight or ten instead of three. The finer the grid, the closer your theoretical best gets to something physically driveable, and the harder it becomes to hide a weak corner between two green columns.

    Sectors as a race weekend weapon

    Sector thinking isn’t only self-analysis. It’s scouting.

    As a kid I’d watch other groups’ sessions and pull their lap times from live timing. Not just the headline numbers. I wanted to know which corners my rivals were strong in, which ones they were slow through, and where they liked to overtake. By the final I had a map of everyone around me. Heck, I could have written a book about my rivals.

    Live timing gives you sectors for every kart on track. If your main rival wins sector one every session and you win sector three, you know where to defend and where to attack before the lights go out. In the heats especially. Heat racing rewards knowing your rival’s weak sector more than your own strong one, and most overtakes are planned two sectors before they happen. Most drivers never read past their own row. Their loss.

    Sector thinking while you drive

    The table is post-session. The skill it builds is mid-session.

    One of the techniques that helped me most in my career is creating mental sticky notes. Memorise what went on in the previous lap, corner by corner, so you can adjust that exact corner on the next lap. It happens in fractions of a second while driving, and it’s nothing more than live sector analysis run in your own head.

    Data trains this. After enough evenings with the sector table, you start noticing mid-session which piece of the lap is drifting. The download then confirms instead of revealing. It costs nothing, and no logger measures it.

    That’s when the tool has done its real job.

    Make the pieces talk to each other

    One caution before you fall in love with the table. Sectors are connected, and karting punishes anyone who optimises them separately.

    A heroic sector two that scrubs your exit speed sends a slower kart into sector three for the full length of its straight. The table shows green then red and you’ll chase the red in the wrong place. When two adjacent sectors trade like that, zoom out and read the corner that joins them, usually with the overlay method.

    The lap is still one thing. Sectors are how you study it, not how you drive it. That mindset, applied across every channel, is the spine of my data analysis routine.

    FAQ

    How many sectors should I use for karting?

    Start with the official three for comparability, then build your own set with one split per corner complex, usually six to ten on a kart track. Fewer hides problems, many more drowns you in columns. The right number is the one where each split answers one driving question.

    Is the theoretical best lap actually achievable?

    Almost. Built from three coarse sectors it’s a touch optimistic, because some sector combinations fight each other. Built from fine sectors it gets close to honest. Either way, drivers regularly get within a tenth of it once consistency improves, which is exactly what it’s for.

    Can I do sector analysis with just a stopwatch?

    Roughly, yes: many tracks have natural markers and a helper can take splits. But GPS sectors are automatic, repeatable and free with any modern logger, and the comparison table is where the value lives. The fuller picture is in the karting telemetry guide.

    Why is my best sector never on my best lap?

    Because pushing for a whole lap forces compromises that a single flying sector doesn’t. It’s normal, and it’s information: it tells you which corner you only get right when you mortgage the ones around it. Fix the compromise, not the sector.


    Alessio Lorandi started karting at six and won the 2013 CIK-FIA Karting World Championship. He raced through Formula 3, GP3 and Formula 2 before founding Purpl, an AI data coach for karting drivers.

  • RPM Data in Karting: Reading the Trace for Gearing and Corner Speed

    RPM Data in Karting: Reading the Trace for Gearing and Corner Speed

    Speed tells you what the kart did. RPM tells you what the engine lived through while it happened.

    Most drivers treat kart RPM data as a peak number to glance at after the fastest lap, and that’s maybe ten percent of what the trace knows. The other ninety percent covers your gearing, your corner speed, your clutch and even your driving mistakes, all written in one jagged line.

    This article is how I read that line.

    Kart RPM data guide cover with purple rev trace on black background

    The shape of a healthy trace

    Open any lap from your data logger and the RPM channel looks like a saw blade. Teeth rising along the straights, valleys cut into the corners.

    On a single-gear kart, RPM and speed are locked together by the sprocket. That makes the trace beautifully honest. It can’t lie. Every peak is the end of a straight, every floor is a corner minimum. The ratio between RPM and speed should barely change all lap.

    When that ratio does change, something mechanical is talking. More on that below.

    What kart RPM data tells you that GPS can’t

    GPS speed comes from satellites watching the kart. RPM comes from the engine itself, sampled off the ignition. Two different witnesses. The gaps between their stories are where the information hides.

    Three things only the RPM trace will confess. First, clutch slip: revs spike off a slow corner while speed climbs lazily behind them. Second, a bogged engine: the floor of the valley drops below the power band and the whole exit suffocates. Third, chain and carburetion trouble, which show up as a ratio drift or a peak that fades lap after lap.

    None of those appear in the speed trace until they’ve already cost you time. The revs show the cause, the speed trace shows the bill.

    Gearing: the trace’s main job

    Here’s the reading that pays for the logger. Look at peak RPM at the end of the longest straight, lap after lap.

    Kart RPM trace comparing short and long gearing with annotated peak and minimum revs

    Too short a ratio and the engine reaches its ceiling with track still left, so the trace flattens against the limiter and you’re a passenger for the last metres. Too long and the peak never gets near the power band’s top, so the engine pulls like it’s towing a trailer out of every corner.

    Your engine has a happy zone, your tuner can tell you its numbers for your class, and the job of gearing is to keep the whole lap inside it. Peaks near the top of the zone, corner floors above its bottom edge. That’s it.

    The full sprocket-choosing method lives in the gear ratio guide. The basic mechanical trade is well explained in this gear ratio primer: more rear teeth buys acceleration, fewer buys top speed. The RPM trace is how you find out which one the track is asking for.

    The corner floor: where races are lost

    Now look at the bottom of each valley. That’s minimum RPM, and on a low-powered kart it decides the whole exit.

    Drop a couple of hundred RPM below the power band in a hairpin and the engine bogs. The kart then crawls through the first metres of the straight, and no amount of top end repays that. I learned this with my own hands as a kid, training with sprockets one or two teeth longer than optimal to force myself into higher minimum speeds.

    This is also where RPM data exposes excuses. A driver once told me his sprocket was too small, so the engine had no bottom. The honest version of that sentence is different. He needed to use more track and open up the corner, carrying more minimum speed and keeping the RPMs up mid-corner, to make that smaller sprocket work.

    Same trace. Two different drivers reading it. Excuse makers versus problem solvers. The racing line is an RPM tool, whether you think of it that way or not.

    One corner, two traces

    Here’s a worked read from a club-day download. Hairpin at the end of the back straight, single-gear kart, driver convinced the engine is tired.

    The speed trace shows a decent minimum. Nothing alarming there. But the RPM floor sits 300 revs below the band, and the first half of the exit slope climbs like wet cardboard.

    Diagnosis? The corner is being driven too stopped for this gearing. Classic. Braked, turned, fired, and the engine never got its revs back in time to do the firing.

    Two candidate fixes, in order. Drive the corner rounder and keep the floor up, which costs nothing and pays everywhere. Or accept the driving style and gear for it, the trade explained from the exit side in corner exit speed.

    What you don’t do is leave the mismatch in place all weekend. And drivers do, every weekend, because nobody put the two traces on the same screen.

    Bottom versus top across a race

    Gearing isn’t only a lap-time question. It’s a race-shape question. Almost nobody analyses that part.

    Run a short sprocket, with lots of bottom compared to top, and you’ll be faster than most in the opening laps. Everyone is sliding around looking for grip, the tyres are cold, and the minimum speeds are low. You’ll make up a couple of places early.

    Then the grip comes, minimum speeds rise, your top end dies halfway down the straight, and the drivers who geared for the race’s end arrive with a head of steam. You see where I’m going? Nobody gets to be fastest at every stage. The trace from the previous final tells you which stage you bought, and whether you’d buy it again.

    Chart of kart lap time advantage across race laps for short versus long gearing

    Shifter karts: four extra questions

    A KZ gearbox multiplies the reading. When I compare RPM against another driver in a shifter, I run a fixed list.

    What gears are we using, and do we shift at the same point? Does he make a short shift where I pull the full gear? At what RPMs is he upshifting? Who’s using more engine brake in the hairpins?

    Each answer is worth real time, because gear choice in a KZ changes the shape of every exit. And the engine brake question changes the entries too, which connects this channel straight back to braking technique.

    Comparing revs between two karts

    RPM is the channel most abused by the excuses hat. A driver sees 200 RPM missing against his teammate at the end of the straight and declares the engine dead.

    Hold on. Check three things before blaming the engine. Was the reference lap towed in a slipstream? Did the reference driver exit the previous corner faster, which the whole straight then inherits? And are the carburetion and jetting actually comparable that session, which is its own subject covered in jetting by the numbers?

    In my experience most missing revs are missing exits. Check the exits first. It’s not what drivers want to hear, because an engine problem costs money and an exit problem costs pride, and pride invoices are the ones we all avoid opening. The overlay method in comparing two laps settles it in five minutes. A broader primer on what each channel is for sits in the karting telemetry guide.

    A ten-minute RPM routine

    After each session, three checks. Peak RPM on the main straight across all laps: is it in the happy zone, and is it stable? Minimum RPM in the two slowest corners: above the bog line or below it? Ratio sanity: does speed divided by RPM stay constant, or is the clutch eating your exits?

    Write the peak number on the setup sheet next to the sprocket you ran. Every time. Two race weekends of that habit and gearing stops being a guess. It becomes a lookup, the way 2-stroke classes running 10,000 to 15,000 RPM have always demanded, as the REV gearing guide lays out with charts.

    One more habit worth stealing. When the track changes during the day, re-check the peaks before you re-check anything else, because rubber going down raises minimum speeds and drags the whole trace upward with them.

    The sprocket that was right at nine in the morning is often a tooth wrong by the final. The trace knew at lunchtime.

    FAQ

    What RPM should my kart be pulling?

    There’s no universal number. Each engine class has its own band, set by the builder and the rules. The useful question is relative. Are your peaks and floors inside your engine’s zone? Do they match the quick karts in your class on the same track?

    Why does my RPM spike without the speed rising?

    That’s slip. Off slow corners it’s usually the clutch; under power everywhere it can be a tired chain or wheelspin on a green track. The ratio check above catches all three, and the fix is mechanical, not driving.

    Is a higher peak RPM always faster?

    No. A higher peak often just means shorter gearing, bought at the cost of a weaker run through the middle of the straight. Judge gearing by lap time and exit quality, never by the biggest number on the dash.

    Do I need an RPM sensor or is GPS enough?

    Every mainstream kart logger reads RPM off the ignition lead as standard, so you almost certainly already have it. GPS alone leaves you blind to clutch slip, bogging and carburetion drift, which are exactly the problems RPM exists to catch.


    Alessio Lorandi started karting at six and won the 2013 CIK-FIA Karting World Championship. He raced through Formula 3, GP3 and Formula 2 before founding Purpl, an AI data coach for karting drivers.

  • Kart Sensors Explained: RPM, Temperature, Speed and GPS

    Kart Sensors Explained: RPM, Temperature, Speed and GPS

    At club level, three numbers run the whole show. Tyre pressure, water temperature, RPM for the sprocket choice.

    At international level the bar rises, big time, and the kart sensors multiply with it. Tyre temps, exhaust temps, head temps, brake temps, lambda, combined G. Each one guards a piece of performance, and each one is a small purchase that only pays if you know what it’s telling you.

    This is the map of all of them: what each sensor measures, the window it watches, and when it earns its place on your kart. The map goes ring by ring, from must-have to nice-to-have.

    Kart sensors explained guide cover with purple sensor diagram on black

    The idea that organises everything: the window

    Every component on a kart has an optimal operating range. Engine, carburettor, exhaust, tyres, radiator, brakes.

    A sensor exists to tell you whether its component is inside that window or outside it. That’s the entire job. Water temperature has a target; the sensor reports the distance from it. EGT has a sweet spot the engine tuner found on the dyno; the sensor says whether today’s carburetion lives there.

    Miss one window and you give up lap time “to charity”, as I like to say, even with everything else perfect. The windows move with conditions, track to track, session to session, which is why the sensors stay on the kart instead of being a one-time test.

    The core three: every kart, every level

    Go kart sensors stack from core trio to advanced additions by racing level

    GPS. Speed, position, lap timing in one receiver, and the source of the speed trace that carries most analysis. Built into nearly every modern kart data logger; its honest limits are covered in GPS accuracy, and the timing side in how lap timers work.

    RPM. Read off the ignition lead, no installation drama. Gearing, clutch health, corner-floor revs and limiter time all live here, the full reading in kart RPM data.

    Water temperature. The engine’s thermostat readout and the number drivers manage lap by lap with the radiator curtain. It has the clearest target of any channel, and its own deep-dive in kart water temperature.

    Those three, plus lap timing, are the spine. A driver who masters only them is better instrumented than half a club grid. Genuinely. Walk any club paddock and count the loggers being used as lap timers only.

    The second ring: carburetion’s witnesses

    Two-stroke engines live and die by mixture, and two sensors watch it.

    EGT, exhaust gas temperature. The classic carburetion gauge: a probe in the exhaust reporting the burn. Tuners define a window for the top of the rev range and another for the bottom, say 630 to 640 degrees up top and 440 to 450 down low. The trace shows whether you’re living in them. The full method is in the kart EGT guide.

    Lambda. The oxygen sensor, measuring mixture directly instead of inferring it from heat. My own preference, honestly, because it gives more accurate information than EGT, at more cost and fragility. The trade-offs live in the lambda sensor guide.

    Head temperature, CHT. The air-cooled classes’ substitute thermometer, vital in Mini 60 where there’s no water to measure. Whether you want CHT, water temp or both is its own small decision, settled in CHT versus water temp.

    The third ring: where internationals are won

    Past the carburetion pair, sensors stop being standard and start being statements.

    Tyre temperature tells you whether you’re overheating the rubber or never waking it up, through driving or setup. Brake temperature explains the spongy pedal on a hot day and guides pad choice, soft for cold conditions, hard for heat. And combined G, from the logger’s accelerometer, scores whether the driver is using the grip at all, or whether the kart’s balance never let him.

    None of these wins a club race. All of them together are why international teams look like laboratories, and why their drivers get answers in one session that club drivers chase for a month.

    One sheet, every number

    Sensors multiply, and the tent drowns in numbers unless they’re organised. Here’s the habit I learned to keep them honest.

    One row per session in a spreadsheet: average tyre temps, average hot pressures, average water temp across the fastest lap. EGT minimum and maximum recorded separately, RPM minimum and maximum, metres on the limiter. Then colour-code each cell against its window, green inside, red running hot, blue running cold.

    One glance tells you which parameter left its window before anyone starts arguing. The ready-made version of that sheet lives with the data starter download in the analysis cluster, and the wider reading method in the karting telemetry guide. Numbers have got no emotions. That’s exactly what makes them useful.

    What chasing a window looks like

    An example makes the window idea concrete, so take the one I lived every summer.

    Water temp target, say 50 degrees. The driver runs the curtain lap by lap to hold it there, eyes flicking to the dash on the straight. If the dash says 56, lap time has already been given away, and the sheet will show it later in red.

    Now multiply that by every sensor on the kart. Tyres at their best around 80 to 85 degrees. EGT inside the tuner’s dyno window. RPM floor above the bog line. Each one a small dial, each one watched by a cheap probe, and the kart only flies when they all agree.

    That’s what teams mean by being “in the window”. Not magic. Dials.

    Buying order, from my coaching years

    The question I actually get isn’t “what sensors exist”, it’s “what next”. My order, assuming the core three are on the kart.

    EGT or lambda first the day you start tuning carburetion seriously, lambda if the budget allows my preference. Head temp instead, immediately, if you’re in an air-cooled class. Tyre temperature gun before tyre temperature sensors; the gun teaches the same lessons for a tenth of the price, and it never has a wiring fault. Brake temps only when you’re racing somewhere hot enough to cook the pedal.

    And before any of it: make sure the install is right, because a perfect sensor mounted badly produces confident fiction. Wiring and placement are covered in data logger installation, the faults it prevents in lap timer troubleshooting, and the power side in battery care.

    The sensor that matters most is the cheapest

    After all the probes and the price tags, the most valuable sensor package on a kart is still the free one.

    The driver. Your hands feel the front grip, your back reads the rear, your ears track the engine, and no probe on the market measures commitment. Sensors exist to confirm, sharpen and sometimes overrule what the driver felt, never to replace the feeling itself.

    I’ve seen kids with full international sensor kits who couldn’t tell you what the kart was doing in turn three. And club drivers with a bare logger who could read their session like a book. The hardware gap was real. The understanding gap mattered more.

    Buy sensors to answer questions you already have. The drivers who do are the ones whose tents get quieter and faster at the same time.

    What the dash should show

    A pile of sensors does not mean a busy screen. While driving, you scan between the braking zone, the apex, and occasionally the dash: water temp, exhaust temp, lap time, RPM, in fractions of a second.

    So the dash gets the live-management numbers only, water temp for the curtain and EGT if you’re actively jetting. Everything else records silently for the laptop. A sensor’s home is the post-session debrief, not your eyeline at 100 km/h, and which logger tier records what is mapped in 1T versus 2T loggers.

    FAQ

    Which kart sensors should a beginner start with?

    The ones already in the box: GPS, RPM and water temperature come with practically every modern logger. Master reading those three for a season before spending another euro, because no added sensor fixes an unread speed trace.

    What’s the difference between kart temp sensor types?

    Water temp reads coolant, CHT reads the cylinder head itself, and EGT reads exhaust gas. Water and CHT guard engine health and cooling; EGT guards carburetion. Air-cooled classes substitute CHT for water; everyone else treats EGT as the tuning channel.

    Are more sensors always better?

    No. Sensors you don’t read are weight, cost and wiring failures waiting to happen. The KartPulse forums are full of temperature threads from drivers with full sensor kits and no targets. Buy the sensor after you know its window, not before. Your spreadsheet’s blank columns are the shopping list.

    Do rental karts have any of this?

    Usually just lap timing from the venue. Which is fine: rental driving builds precision and consistency, the skills covered in this blog’s getting-started articles, and none of them need a probe. Sensors join the story when you own the engine they’re protecting.


    Alessio Lorandi started karting at six and won the 2013 CIK-FIA Karting World Championship. He raced through Formula 3, GP3 and Formula 2 before founding Purpl, an AI data coach for karting drivers.

  • Kart Data Loggers Explained: What They Record and Why It Matters

    Kart Data Loggers Explained: What They Record and Why It Matters

    A kart data logger is the least glamorous purchase in your racing budget. And probably the highest-return one. It’s also the purchase most surrounded by brand tribalism.

    Walk through any paddock and you’ll hear strong opinions about which unit is “better”, usually from people who have never opened the analysis software of either.

    I’ve raced and coached with every major system out there, so here’s what these devices actually do, and what’s worth paying for. And what the brand arguments get wrong.

    Kart data loggers explained guide cover graphic

    The three parts of every system

    Strip away the marketing. Every karting data system is the same three blocks.

    Diagram of a kart data logging system: display logger, sensor loom and analysis software

    The steering-wheel unit is the recorder: screen, memory, GPS receiver, battery.

    The loom brings it signals: an RPM lead wrapped around the spark plug wire, then a temperature sensor in the cylinder head or the water circuit. Optionally exhaust gas temperature or more.

    And the software on your laptop or phone is where recordings become decisions, the part that actually produces lap time. And the part I cover separately in how to analyze kart racing data.

    Notice what’s missing compared to a race car. No brake pressure. No throttle position.

    No steering angle as standard. Karting telemetry infers driver inputs from their consequences, speed and revs, which is why learning to read those two channels properly matters so much.

    The full channel-by-channel tour lives in kart sensors explained.

    What the channels are for

    GPS gives you position. Position becomes speed. Then racing line, lap and sector times.

    This is the channel that answers “where am I slow”. Ten samples per second is honestly enough. Twenty-five draws prettier lines.

    The accuracy debate has more myth than measurement in it, so I wrote a separate piece on GPS accuracy with the real numbers.

    RPM tells you about gearing and engine use: whether you pull the right revs at the end of the straight, whether you drop out of the powerband in slow corners. How the clutch behaves off the line.

    Paired with speed it exposes things neither shows alone. The detail is covered in reading kart RPM data.

    Temperatures are insurance first. Tuning feedback second. Water temperature trends warn you before a seize.

    EGT guides jetting on two-strokes. They don’t make you faster on Saturday. They make sure you still have an engine on Sunday.

    Where the money matters (and where it doesn’t)

    Chart ranking kart data logger features by real value: GPS quality first, brand prestige last

    My buying logic, in order. Pay for GPS quality. Every analysis you’ll ever do sits on top of it.

    Pay for the sensor inputs you will genuinely connect. Not the expansion possibilities you won’t.

    Pick the system whose analysis software you can tolerate spending evenings with, because the best hardware feeding software you hate equals data you never look at.

    Don’t pay extra for screen real estate. A kart dash needs to show a lap time and a temperature, and as I argued in the telemetry guide, you shouldn’t be reading it mid-lap anyway.

    The dash is the least important part of a data system, and it’s the part the brochures sell hardest.

    And the brand question everyone actually asks. At the level of recording speed, revs and temperature, the major systems are interchangeable, and I’ve taken titles with different brands on the wheel.

    Buy used. Buy what your team or your track’s fast guys run, so you can share reference laps, then spend the difference on track time.

    A previous-generation unit records the same physics the new one does.

    What to run at each level

    Different karting lives need different systems. So here’s the honest matrix I give people who ask.

    Rental and first-season club drivers? A phone app or an entry GPS lap timer is enough, because the skill you’re building is driving. Not analysis.

    And any money beyond €150 belongs in track time instead. The moment you own a kart and race a championship? Move up.

    Club racers and juniors? A used previous-generation colour unit with GPS, RPM and one temperature input.

    This is the sweet spot of the whole market: roughly €250-400 buys you ninety-five percent of the analysis capability of anything on sale.

    This is also the level where the analysis habit gets built, which matters infinitely more than the hardware carrying it.

    Serious national and international racing? Current-generation unit, two temperature channels, and most importantly the same brand your team runs.

    Reference laps from teammates are the most valuable data you’ll ever load, and formats don’t always cross brands cleanly. At this level you’re also analysing between every session, so the software workflow speed starts being worth money.

    Four-stroke endurance and LO206-style racing? Prioritise battery life and water resistance over channel count. The engines are sealed anyway, so GPS quality is nearly the whole purchase.

    Rules: what competition allows

    Logging is broadly legal everywhere. Transmitting is the line you can’t cross.

    International technical regulations permit on-board data acquisition but prohibit live telemetry to the pits and two-way communication with the driver, and most national series copy that stance. Two practical consequences.

    First, your analysis loop is necessarily between sessions. That’s why the twenty-minute routine matters.

    Second, check your class rules on sensor placement before drilling anything: some sealed-engine classes restrict what you may attach to the engine, even passively.

    The current technical regulations live at FIA Karting. Your national federation’s annexes override them locally.

    Channels worth adding later

    Once the core habit is built, some additions genuinely earn their wiring. A second temperature channel is first.

    Water plus EGT on a two-stroke turns jetting from folklore into measurement, the method in the EGT guide.

    A lambda sensor goes one step further into mixture truth, though it’s tuner territory, covered in lambda sensors in karting.

    A wheel speed sensor on a front wheel, compared against GPS speed, exposes locking in braking zones, which is as close as karting gets to a brake pressure channel.

    What I’d skip? Steering sensors and accessory G-sensors at club level. The information is real.

    But the analysis time it demands is the scarcest resource you have, and the same evenings spent mastering speed and RPM pay better.

    Add channels when your questions outgrow your data. Not before.

    The wishlist conversation comes up constantly in club paddocks. And the honest answer? Most of the grid hasn’t extracted half the value of the two channels they already record.

    How the data leaves the kart

    The unglamorous detail that decides whether analysis actually happens? The transfer.

    Cable downloads are the reliable workhorse. Slow but boring in the good way.

    WiFi and app-based transfers are quicker when they work, and infuriating in a crowded paddock when sixty units share the spectrum. So always know your cable fallback.

    Files land in each brand’s proprietary format. Readable by its own software.

    For anything cross-brand, spreadsheets, your own scripts, or AI analysis tools, you’ll want the CSV export, the workflow documented in exporting telemetry to CSV.

    Set a personal rule. Data off the kart before the kart goes on the trolley.

    Sessions that don’t get downloaded the same hour have a way of never getting downloaded at all. And an undownloaded session is a session you paid full price for and only half attended.

    Second-hand buying checks

    Most first loggers should be used ones, so here’s the five-minute inspection.

    Power it on and check the battery holds charge. Replacement internal batteries are cheap but corroded charging contacts are not, and battery neglect is the number one killer, something I’ve detailed in data logger battery care.

    Check the GPS gets a fix outdoors within a couple of minutes, and inspect the RPM lead and connectors for cracked insulation.

    Download a sample session to your laptop before money changes hands; a unit that records but won’t export is a paperweight with a screen.

    Mounting and wiring the thing properly is its own small science, vibration is the enemy of every connector. And the right way is documented in mounting a data logger the right way.

    A short history, for perspective

    It’s worth remembering how new all this is. In the nineties, karting data meant a stopwatch in a parent’s thumb and an exhaust temperature gauge if you were fancy.

    The first affordable onboard lap timers arrived with magnetic strip detection, a sensor under the floor tray counting strips buried in the track. And drivers planned their weekends around which circuits had strips at all.

    GPS units changed everything in the 2010s. Suddenly every lap carried its own map, sector times stopped depending on track infrastructure, and line analysis became available to anyone with a laptop.

    The reason this history matters to a buyer: the core GPS-plus-RPM recipe has been mature for over a decade, which is exactly why used units are such good value. And why this generation’s marketing leans on screens and apps.

    The physics being recorded stopped changing long before the brochures did.

    The next real shift is happening in the software layer, in what reads the data rather than what records it, and that’s the part moving fast right now.

    The honest limits

    A logger records. It doesn’t coach.

    The drivers I see making the biggest gains from identical hardware are the ones treating it as a question machine. Pick a question before the session. Get the answer from the download.

    Change one thing. The ones making no gains? They use it as a lap-time display with extra steps.

    Know the failure modes too. GPS dropouts near tall structures or under metal roofs, which is why your timing reads strangely in some pit lanes.

    Interference on RPM leads routed alongside the plug wire’s full length. The fixes are simple, and most “my logger is broken” posts describe installation problems, which is why why your lap timer isn’t reading laps exists as its own article.

    If you remember one sentence from this article, make it this one: the logger on your wheel is a recorder. The lap time lives in what you do with the download, and the cheapest unit reviewed honestly beats the most expensive one admired on a shelf.

    FAQ

    Do I need a transponder if I have a data logger?

    Yes, they do different jobs. The race organiser’s transponder feeds official timing and scoring. Your logger is private analysis.

    They don’t talk to each other, and on a race weekend you’ll run both.

    1T or 2T version, what’s the difference?

    The number of temperature inputs. One or two. Two matters if you want, say, water plus EGT simultaneously.

    Which two-stroke tuners do want. The full decision logic is in 1T vs 2T loggers.

    Can I start with just a phone app?

    For rental karting and first experiments, phone GPS apps are a real entry point, and the hardware conversation on communities like KartPulse covers them honestly. For owner karting the dedicated unit wins quickly: vibration-proof mounting, RPM and temperature inputs, and far better GPS.


    Alessio Lorandi started karting at six and won the 2013 CIK-FIA Karting World Championship. He raced through Formula 3, GP3 and Formula 2 before founding Purpl, an AI data coach for karting drivers.

  • Delta Time: The Most Useful Trace Most Karting Drivers Ignore

    Delta Time: The Most Useful Trace Most Karting Drivers Ignore

    Every analysis screen has one line that answers the only question that matters: where, exactly, am I losing time?

    That line is delta time. In telemetry software it hides under different names, delta-t, time slip, time variance, but it’s always the same idea. The running gap between two laps, drawn at every metre of the track.

    Most karting drivers never open it. They stare at speed traces instead, which is like reading the witness statements before anyone has told you where the crime happened.

    Delta time telemetry explainer cover with purple delta trace on black

    What the line actually is

    Take two laps. At every point on track, subtract one elapsed time from the other. Plot the result against distance.

    That’s the whole construction. Where the line is flat, the two laps are matching each other. Where it climbs, you’re losing time at that exact spot. Where it falls, you’re gaining it back.

    It’s the only channel on the screen that’s already done the comparison for you, which is exactly why it’s the one to open first and the one beginners open last.

    The reference lap can be your teammate’s best, your own best, or your theoretical best stitched from fastest sectors. The line means something different against each one, which is why picking the reference is half the skill.

    How to read delta time telemetry: three shapes

    After years of doing this with drivers, I’ve found almost every delta line is built from three shapes.

    Delta-t analysis chart showing step, ramp and sawtooth shapes in a karting delta trace

    The step. Flat, then a sudden climb at one corner, then flat again. One specific mistake with an address. The step is the happiest diagnosis you can get: one corner, one fix. Go look at the speed trace right there and nowhere else.

    The ramp. A slow steady climb along a straight. That’s not a driving moment, that’s a deficit being collected: gearing, a slipstream on the reference lap, or an exit speed gap from the corner before. The diagnosis method is in kart RPM data.

    The sawtooth. You gain into every corner and give it back on every exit, or the reverse. Nothing is broken. Two driving styles are disagreeing, U against V, and the delta is scoring the argument corner by corner. The shapes themselves are covered in how to read a speed trace.

    Read the delta first, always. Then open the other channels only where it moved. That reading order is the spine of my whole overlay method.

    One warning about flat. A flat delta doesn’t mean a perfect lap, it means a lap identical to the reference, mistakes included.

    Two drivers braking forty metres early at the same corner produce a beautiful flat line between them. The delta only knows differences. Choose a reference worth differing from.

    A corner read in numbers

    Let me make the step shape concrete with a hypothetical that plays out at every club track.

    Say the delta runs flat at +0.05 through the first sector. Then it steps to +0.21 across the hairpin and holds there to the line. That corner cost 0.16, and nothing after it added damage.

    So the session has exactly one project. Open the speed trace at that hairpin only. An earlier brake point, a lower minimum and a lazier exit slope each write a different prescription, and the same step logic scales up a level in sector analysis.

    Numbers first, channels second. The delta tells you the cost. The other traces tell you the cause.

    The session view most people skip

    Lap-against-lap is only half the channel. The other half is delta against your own average.

    Build the reference from your mean race lap and the line turns into a stint report. Early laps under the line and late laps climbing over it means your pace is dying with the tyres, or with your neck. The neck part isn’t a joke either: a late-stint climb with clean lines is a fitness verdict, and no sprocket fixes fitness. Random scatter around zero means the pace is fine and the repeatability isn’t, which is better news, because repeatability is cheaper to fix.

    I rate drivers on this view more than on any single lap. One fast lap proves potential. Twenty laps hugging the line prove a racer.

    The math that should scare you

    Here’s a worked example I use with drivers, because the numbers are small and the consequences aren’t.

    Say the track record is 46.5 and we’re both lapping at 99.5% of the limit, a 46.733. I’m leading by a full second with five laps to go. Comfortable, right?

    Then pressure does its work. I get conservative and slip to 99.2% of the limit, a 46.875. The driver behind, with nothing to lose, pushes up to 99.8% and does a 46.593. The delta between us is now 0.282 seconds per lap.

    A one-second lead divided by 0.282 is three and a half laps to zero. And in karting you don’t need zero. A 0.10s gap is enough to send it down the inside, which arrives in 3.19 laps. My “comfortable” second was never comfortable. The delta knew before I did.

    Time slip racing data worked example: 0.282s per lap closes a one second lead in 3.19 laps

    That’s what delta thinking gives you that lap times don’t. A lap time is a verdict. A delta is a forecast. Forecasts win races.

    Run the arithmetic on yourself once mid-season. If your average lap sits three tenths off your best, that’s three tenths times every lap of a 25-lap final, seven and a half seconds handed to the field. Do that math on yourself one evening. It stings, and it should.

    Reference laps, and what each one teaches

    Against a faster teammate from the same session, the delta is a shopping list. Each climb is a corner where his driving is purchasable, and the questions to ask there are in the lap comparison guide.

    Against your own theoretical best, the delta measures consistency. The climbs show which corners you only get right sometimes, the subject of lap time analysis and lap consistency.

    Against your own average lap, it shows your race pace truth. Qualifying heroes hate this reference. It’s the honest one.

    And honesty compounds. The driver who reads this view weekly knows his real pace to the tenth, while the one who keeps only best laps builds a museum of flattering days.

    Should the delta live on your dash?

    Modern dashes will happily flash a live delta at you every sector. My opinion, and I know it costs me an argument every time: leave it off while you drive.

    I’ve watched a live delta kill laps a hundred times, including from inside my own helmet. You see the number, the brain starts doing maths instead of driving, and you brake early “just in case”. The delta is a debrief tool. It earns its keep on the laptop after the session, not in your eyeline at the apex.

    Where this gets interesting is what’s coming. Software that reads the delta for you, between sessions, in plain language, is already arriving in sim racing and it’s the direction we’re taking Purpl. The discipline stays the same either way. The analysis happens after the lap, never during it. Tools that whisper the delta sensibly between sessions will change who wins club championships, and the drivers who built the habit early will be the ones it helps most.

    Five minutes, every session

    Download, pick the reference, read the delta left to right. Find the biggest climb. Open the speed trace at that corner only, decide one change, go drive it.

    That’s the entire workflow, and it’s five minutes once the habit sets. The longer version, with sectors and full-session review, is in how to analyze kart racing data. If you want a second explanation of the channel itself, the data engineer Samir Abid wrote a clean introduction to delta-t.

    HP Academy also keeps a worked video lesson on the time delta channel if you learn better by watching someone scrub a cursor.

    FAQ

    Are delta time, time slip and time variance the same thing?

    Yes. Different software brands name the same channel differently. AiM calls it time variance, MoTeC users say time slip, broadcast graphics say delta. Television popularized the word, but engineers were reading this channel decades before it reached your living room. The construction underneath is identical: elapsed time difference against a reference lap, plotted by distance.

    Which lap should be my reference?

    For finding pace, the fastest clean lap available from the same session, yours or a teammate’s. For consistency work, your theoretical best. Avoid references from other days; grip moves too much and the delta starts measuring the weather instead of you.

    Why does my delta line drift even on the straights?

    Usually a distance-sync issue. If the two laps’ start lines or GPS tracks don’t align, the whole comparison shears sideways. Check that your software is aligning by distance, and that both laps come from the same beacon or start-line definition.

    Can a GPS-only logger show delta time?

    Yes. Delta needs only position and time, which is exactly what GPS records. Every mainstream analysis package computes it from there, no extra sensors required.


    Alessio Lorandi started karting at six and won the 2013 CIK-FIA Karting World Championship. He raced through Formula 3, GP3 and Formula 2 before founding Purpl, an AI data coach for karting drivers.